
설명
볼륨 버블 – cTrader 맞춤형 지표
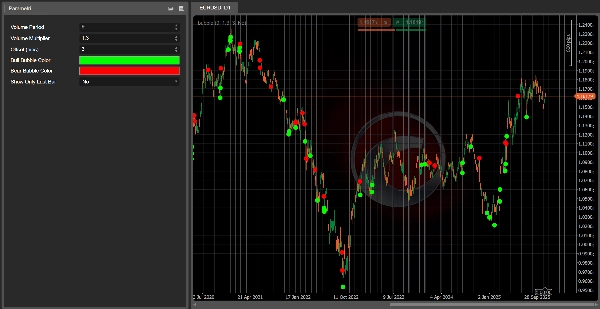
볼륨 버블은 cTrader용으로 가볍지만 강력한 시각적 지표로, 예외적인 거래량을 가격 차트에 직접 강조 표시합니다.
거래량 히스토그램을 응시하며 어떤 막대가 진짜 중요한지 추측하는 대신, 이 도구는 현재 캔들의 거래량이 최근 평균보다 현저히 높을 때를 자동으로 감지하고 해당 막대에 버블(원 아이콘)을 그립니다:
- 강세 캔들인 경우, 버블은 캔들의 저가 아래에 그려집니다.
- 약세 캔들인 경우, 버블은 캔들의 고가 위에 그려집니다.
이로 인해 잠재적인 클라이맥스 움직임, 대형 플레이어의 강한 관심 구역, 또는 추세의 소진 지점을 매우 쉽게 식별할 수 있습니다.
주요 특징
- ✅ 틱 거래량 이동평균을 사용하여 고거래량 캔들을 감지합니다
- ✅ 차트에 명확한 버블을 그립니다 (추가 서브창 불필요)
- ✅ 강세와 약세 거래량 급증에 대해 다른 색상을 사용합니다
- ✅ 캔들에서 버블을 떨어뜨리기 위한 조정 가능한 핍 오프셋
- ✅ 최신 바에만 버블 표시 옵션 (실시간 거래용)
입력값 / 매개변수
- 거래량 기간 – 거래량 이동평균에 사용되는 막대 수.
- 거래량 배수 – 버블을 트리거하기 위해 막대가 평균 거래량보다 몇 배 더 높아야 하는지.
- 오프셋 (핍) – 버블과 캔들의 고가/저가 사이 거리.
- 강세 버블 색상 – 강세 캔들에 표시되는 버블 색상.
- 약세 버블 색상 – 약세 캔들에 표시되는 버블 색상.
- 최신 바만 표시 – 참일 경우, 현재 실시간 바에만 버블을 표시합니다.
사용 방법
차트에 볼륨 버블을 추가하고 시각적 필터로 사용하여:
- 강한 거래량을 동반한 돌파를 확인
- 가능한 반전 또는 소진 캔들
- 대형 플레이어가 활동할 수 있는 구역 식별
독립적인 거래 시스템은 아니지만, 거래량에 관심이 있는 가격 행동 또는 추세 추종 전략에 훌륭한 보조 도구입니다.
👉 여기에서 가입하세요: Algotrendit 볼륨 버블
서버 내에서 다음을 찾을 수 있습니다:
- 이 지표 및 기타 cBot/지표 지원
- 전략 토론 및 최적화 아이디어
- 업데이트, 뉴스 및 향후 출시 도구
요약
AI 요약
Volume Bubbles is a custom indicator for the cTrader platform designed to visually highlight candles with exceptional volume directly on the price chart. It detects high-volume bars by comparing the current candle’s tick volume against a moving average of recent volumes. When a candle’s volume significantly exceeds this average, the indicator draws a colored bubble: below the low for bullish candles and above the high for bearish candles. This visual cue helps traders identify potential climactic moves, areas of strong interest from large market participants, or possible trend exhaustion points.
Key features include adjustable parameters such as the volume period for averaging, volume multiplier threshold, bubble offset in pips, and customizable colors for bullish and bearish volume spikes. Users can also choose to display bubbles only on the latest bar for real-time trading. The indicator integrates directly on the price chart without requiring additional subwindows.
Volume Bubbles serves as a visual filter to confirm breakouts supported by strong volume, spot possible reversals or exhaustion candles, and identify zones of significant market activity. It complements price action and trend-following strategies by providing volume-based insights across various markets including forex, indices, commodities, stocks, and cryptocurrencies.
지표 프로필
고객 리뷰
4.0
리뷰: 1
5 | 0 % | |
4 | 100 % | |
3 | 0 % | |
2 | 0 % | |
1 | 0 % |
고객 리뷰
November 24, 2025
Volume Bubble highlights candles with significantly high volume by drawing bubbles right on the price chart - simple, clever, and efficient. Great for spotting potential climactic moves, blow-offs, or breakout confirmation without diving into separate volume windows. Just remember: context matters. Alerts and built-in stats would make it even better.
상담
자주 묻는 질문(FAQ)
Signal
Indices
Commodities
GBPUSD
RSI
Bollinger
Fibonacci
Scalping
AI
XAUUSD
NAS100
MACD
BTCUSD
Forex
Breakout
EURUSD
NZDUSD
Martingale
Prop
ZigZag
Supertrend
Fair Value Gap
SMC
Crypto
Grid
Stocks
ATR
USDJPY
VWAP
트레이딩 봇, 지표, 플러그인 등 cTrader Store에서 제공되는 상품은 제3자 개발자에 의해 제공되며, 이는 단순히 정보 및 기술적 접근을 목적으로 제공된 것입니다. cTrader Store는 중개인이 아니며, 투자 조언, 개인별 추천 또는 향후 성과에 대한 어떠한 보장도 제공하지 않습니다.


좋아하실 만한 다른 항목


가격
42.11M
거래량
6.13M
핍 수익
211
판매
8.1K
무료 설치