
说明
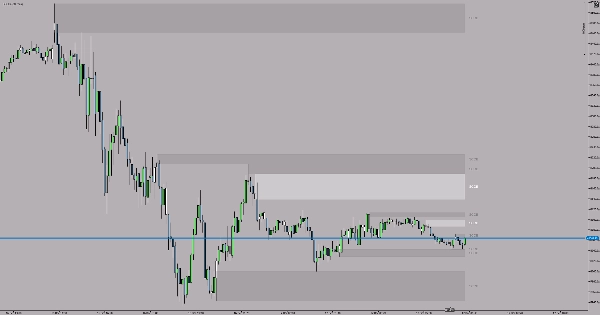
SCOB(单烛订单区块)指标会自动识别并突出显示图表上的强力订单区块模式。这个简单而有效的工具帮助交易者发现关键的反转模式,这些模式通常表明强烈的机构活动。
什么是SCOB?
SCOB是一个由三根蜡烛组成的模式,揭示潜在的反转区域:
看涨SCOB:
- 第二根蜡烛的最低点低于第三根蜡烛
- 第一根蜡烛的最低点高于第二根蜡烛的最低点
- 第一根蜡烛收盘价高于第二根蜡烛的最高点
- 第二根蜡烛被突出显示 作为潜在的支撑区
看跌SCOB:
- 第二根蜡烛的最高点高于第三根蜡烛
- 第一根蜡烛的最高点低于第二根蜡烛的最高点
- 第一根蜡烛收盘价低于第二根蜡烛的最低点
- 第二根蜡烛被突出显示 作为潜在的阻力区
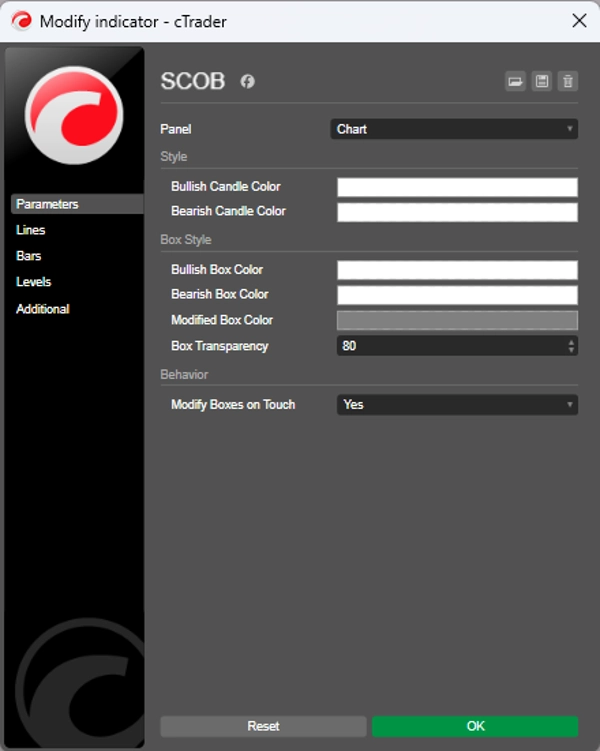
设置
看涨蜡烛颜色 - 选择看涨SCOB模式的高亮颜色(默认:白色)
看跌蜡烛颜色 - 选择看跌SCOB模式的高亮颜色(默认:黄色)
使用提示
- 使用SCOB模式识别潜在的入场区域
- 结合其他技术分析工具进行确认
- 被高亮的蜡烛代表关键的机构级别
- 始终顺势交易以获得更高概率的设置
- 可根据您的交易策略应用于任何时间框架
- 最佳实践:在更高时间框架(H1、H4、日线)标记SCOB模式,并顺势交易。
摘要
指标配置
客户评价
4.5
评价:2
5 | 50 % | |
4 | 50 % | |
3 | 0 % | |
2 | 0 % | |
1 | 0 % |
客户评价
October 3, 2025
Helps more when the trader avoids forced trades. It should not replace the chart.
讨论
常见问答
BTCUSD
Forex
Indices
EURUSD
Commodities
GBPUSD
Prop
Scalping
SMC
Crypto
Stocks
XAUUSD
NAS100
USDJPY
cTrader Store 提供的所有产品,包括交易机器人、指标和插件,均由第三方开发者提供,仅供信息参考和技术访问之用。cTrader Store 并非经纪商,不提供投资建议、个人推荐或任何未来业绩保证。


价格
注册日期 05/01/2025
14
销售