
설명
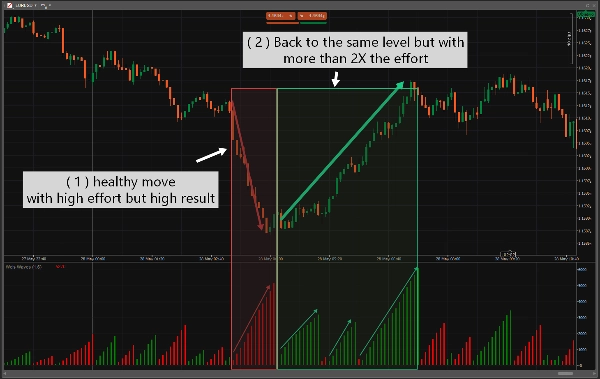
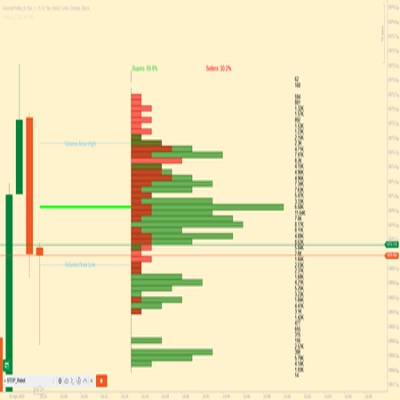
Weis Wave 지표는 Wyckoff 분석과 현대 차트 분석을 결합한 기술자 David Weis의 작업에 뿌리를 두고 있습니다. 그는 이러한 거래량 파동을 사용하여 스마트 머니가 적극적으로 참여하거나 물러나는 시점을 포착했으며, 이는 거래량이 가격 움직임을 검증한다는 Wyckoff 원칙을 따릅니다.
사용 시기:
[ 추세 확인 ]
[ 모멘텀 소진 ]
[ 다이버전스 ][ 흡수]
요약
AI 요약
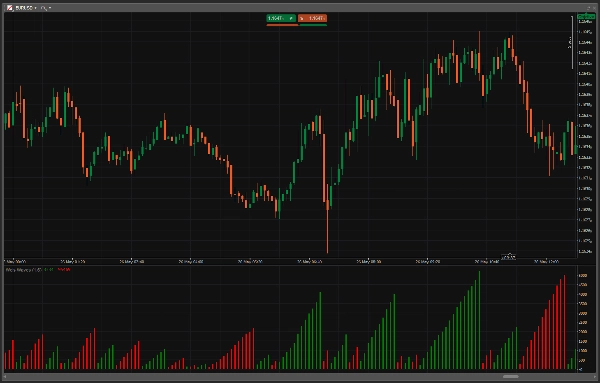
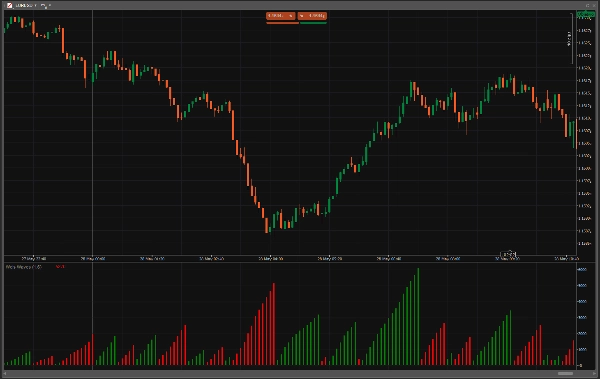
The Weis Waves indicator is based on the original work of David Weis, who integrated Wyckoff analysis with modern charting techniques. It analyzes volume waves to identify when informed market participants ("smart money") are actively involved or withdrawing, following the Wyckoff principle that volume confirms price movements. This indicator is used primarily for trend confirmation, detecting momentum exhaustion, spotting divergences, and identifying absorption phases in the market. It processes bar data with volume information and provides visualizations, filters, and trading signals related to trend strength, reversals, and divergences. The indicator is categorized under volume-based tools and supports analysis of supply and demand zones, imbalances, and on-balance volume concepts.
지표 프로필
지표 카테고리
거래량
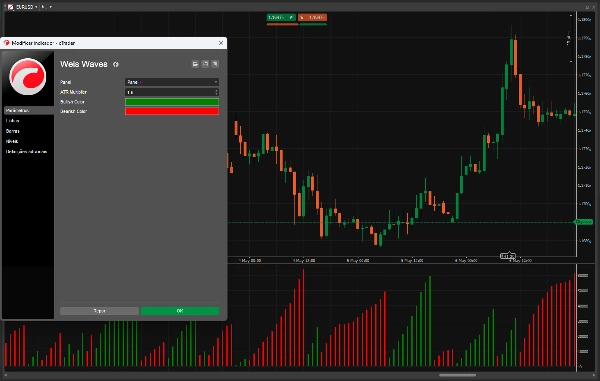
출력 유형
시각화
필터
신호
데이터 요구 사항
막대만
거래량
지원되는 신호
반전
추세 강도
다이버전스
고객 리뷰
0.0
리뷰: 0
고객 리뷰
이 상품에 대한 리뷰가 아직 없습니다. 이미 사용해 보셨나요? 다른 사람들에게 가장 먼저 소개해 주세요!
상담
자주 묻는 질문(FAQ)
Imbalance
OBV
Volume
Supply & Demand
트레이딩 봇, 지표, 플러그인 등 cTrader Store에서 제공되는 상품은 제3자 개발자에 의해 제공되며, 이는 단순히 정보 및 기술적 접근을 목적으로 제공된 것입니다. cTrader Store는 중개인이 아니며, 투자 조언, 개인별 추천 또는 향후 성과에 대한 어떠한 보장도 제공하지 않습니다.
이 작성자의 상품 더 보기


좋아하실 만한 다른 항목


가격
가입일 24/03/2026
10
판매
57
무료 설치