present
Registrieren Sie sich und erhalten Sie $50 Rabatt auf Ihren ersten Kauf
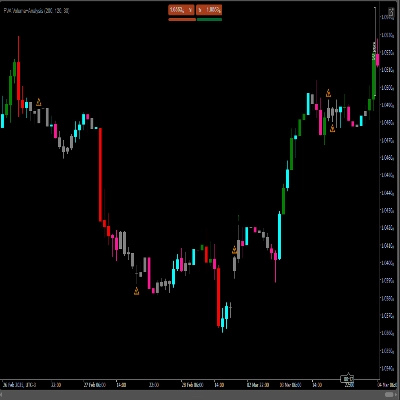
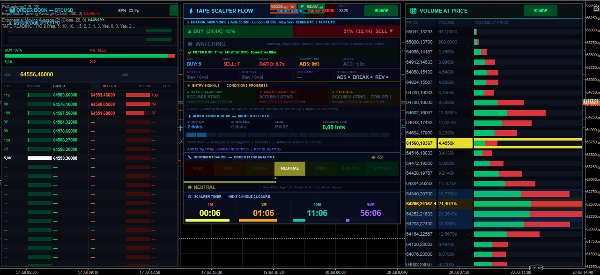
Trading product for Tape Reading 4.2 Indikator Key Levels Volume, image 1
Tape Reading 4.2
Indikator
5 käufe
Version 1.8, Jul 2026
Windows, Mac
4.5
Bewertungen: 4
Trading product for Tape Reading 4.2 Indikator Key Levels Volume, image 2
Trading product for Tape Reading 4.2 Indikator Key Levels Volume, image 3
Trading product for Tape Reading 4.2 Indikator Key Levels Volume, image 4
Trading product for Tape Reading 4.2 Indikator Key Levels Volume, image 5
Trading product for Tape Reading 4.2 Indikator Key Levels Volume, image 6
Trading product for Tape Reading 4.2 Indikator Key Levels Volume, image 7
134
Verkäufe
15.58K
Kostenlose Installationen

Beschreibung

🌐 DOMINIEREN SIE DEN MARKT MIT INSTITUTIONELLEM FLOW-READING

Was es zeigt: tatsächlich ausgeführte Trades — echter Fluss der Aggression.

Vorteile: Dieser Indikator wird durch Tick-Daten dargestellt.

Stellt Geld dar, das bereits im Markt gebunden ist.

Klassifiziert Aggressoren (Käufer/Verkäufer trifft das Ask/Bid).

Erkennt Absorption, Erschöpfung, Beschleunigung des Flusses.


📈Kombinieren Sie mit den kostenlosen Indikatoren, Volumen bei Preis, Volume Squeezer.

https://ctrader.com/products/2514 https://ctrader.com/products/2874


Order Flow

Tape Reading

Ladder DOM

Institutionelle Absorption

Intelligente Ausbrüche

Flow-Umkehrungen

Kauf- und Verkaufsdruck

Echtzeit-Aggressionsanalyse

Das System verwandelt das traditionelle Chart in ein echtes institutionelles Marktlesezentrum.


UNTERSCHIED DES ALGORITHMUS


Während gewöhnliche Indikatoren nur Kerzen analysieren, interpretiert Tape Reading Scalper:

✅ Echte Aggression von Käufern und Verkäufern

✅ Flussgeschwindigkeit

✅ Institutionelle Verteidigung

✅ Order-Absorption

✅ Ladder-Beschleunigung

✅ Durch Fluss bestätigte Ausbrüche

✅ Umkehrungen durch Erschöpfung

✅ Institutioneller vs. privater Druck

✅ Intelligente Lot-Skalierung


SYSTEMSTRUKTUR

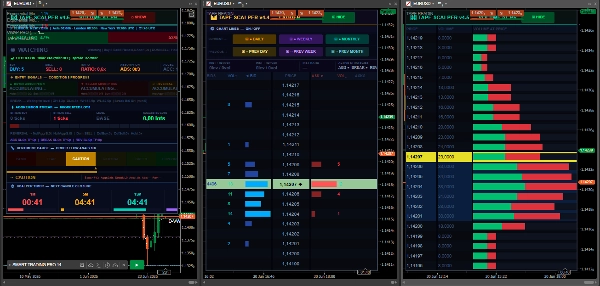
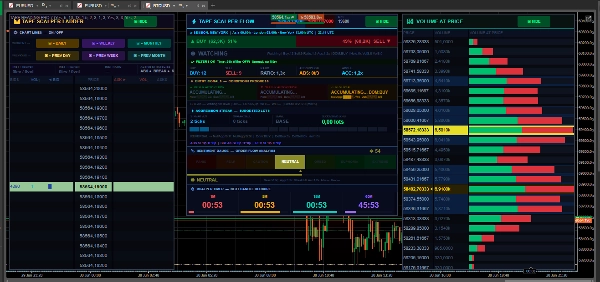
Der Algorithmus verfügt über 2 unabhängige professionelle Panels:


⚡ FLOW-PANEL (FENSTER 1)


Panel verantwortlich für operative Lesung und Signalgenerierung.


Zeigt an:


Käufer-/Verkäuferfluss

Absorption

Umkehrung

Ausbruch

Aggressionsserie

Marktsitzungen

Kauf-/Verkaufsverhältnis

Ladder-Beschleunigung

Dynamischer SL/TP

Operative Filter

📊 LADDER-PANEL (FENSTER 2)


Institutionelles Panel fokussiert auf:


DOM Ladder

Institutionelle Levels

Volumen nach Preis

Institutioneller Druck

POC

Range

Tages- und Wochenhoch/-tief

Preisbuch

Institutionelle Hitze

ERKLÄRUNG DER LADDER-FUNKTIONEN


1. KAUFAGGRESSION


Zeigt die aktuelle Käuferaggression.

Wenn sie schnell ansteigt:

Käufer steigen stark ein. Der Markt kann nach oben beschleunigen. Deutet auf einen möglichen Ausbruch hin.

Je höher die Zahl:

➡ größerer Kaufdruck.


2. VERKAUFSAGGRESSION

Zeigt Verkäuferaggression.

Wenn sie schnell wächst:

Verkäufer dominieren

Mögliche Fortsetzung des Falls

Institutioneller Short-Einstieg


3. KAUF/VERKAUF-VERHÄLTNIS

Zeigt das Verhältnis zwischen Käufern und Verkäufern.

Beispiel:

Verhältnis 2.0x = Käufer dominieren

Verhältnis 3.0x = starker institutioneller Druck

Verhältnis unter 1,0 = Verkäufer dominieren


Interpretation:


Verhältnis-Interpretation

1,0 Gleichgewicht

1,5 Moderater Druck

2,0+ Starker Trend

3,0+ Starker institutioneller Fluss


4. ABSORPTION

Eine der mächtigsten Funktionen des Algorithmus.

Das System erkennt, wenn:

Ein großes aggressives Volumen vorhanden ist

Aber der Preis sich NICHT bewegt

Das bedeutet:

➡ Institutionelle Investoren absorbieren Orders.


KAUFERABSORPTION

Der Markt erhält viel Verkauf, aber:

Der Preis hört auf zu fallen. Institutionelle Verteidigung tritt auf. Mögliche Umkehr zum Kauf.

Signal:

▲ KAUFERABSORPTION

VERKÄUFERABSORPTION

Der Markt erhält viel Kauf, aber:

Der Preis steigt nicht. Verkäufer halten die Bewegung zurück. Mögliche Umkehr zum Verkauf.

Signal:

▼ VERKÄUFERABSORPTION


5. LADDER-BESCHLEUNIGUNG

Misst die Flussgeschwindigkeit im DOM.

Der Algorithmus vergleicht:

Aktuellen Fluss

mit vorherigem Fluss

Wenn er beschleunigt:

➡ Wahrscheinlicher institutioneller Einstieg.


Beispiel:

Wert Bedeutung

1.0x Normaler Fluss

1.5x Starke Beschleunigung

2.0x+ Institutionelle Explosion


6. AUSBRUCHSERKENNUNG

Erkennt echte Ausbrüche.

Das System validiert:


✅ Volumen

✅ Aggression

✅ Geschwindigkeit

✅ Serie

✅ Institutioneller Fluss

✅ Ladder-Beschleunigung


AUSBRUCH KAUF


Bedingungen:

Starke Kaufaggression Ladder beschleunigt Institutioneller Druck Ausbruch des Hochs

Ergebnis:

➡ Validierter Kauf-Einstieg.

AUSBRUCH VERKAUF

Bedingungen:

Starker Verkaufsdruck Verkauf institutioneller Fluss Unterstützungsausbruch

Ergebnis:

➡ Verkauf bestätigt.


7. UMKEHRERKENNUNG

Erkennt Umkehrungen aufgrund von Erschöpfung.

Das System identifiziert:

Aggression verschwindet Institutionelle Verteidigung tritt auf Verlust der Trendstärke

Ergebnis:

➡ Erwartete Umkehr.


8. SERIENSYSTEM

Intelligentes System zur Flusskontinuität.

Zählt, wie viele aufeinanderfolgende Ticks auftraten:

Kontinuierlicher Kauf

oder

Kontinuierlicher Verkauf

SERIENLEVEL

Level Bedeutung

Level 1 Anfangstrend

Level 2 Starker Fluss

Level 3 Explosive Bewegung

9. VORGESCHLAGENE LOTS


Der Algorithmus schlägt automatisch vor:

erhöhte Lotgröße

reduziertes Risiko

operative Skalierung


Basierend auf:


✅ Flussstärke

✅ Kontinuität

✅ Institutionelle Intensität


11. POC (POINT OF CONTROL)

Zeigt den Preis mit dem höchsten Handelsvolumen.

Bedeutung:

Starke Unterstützung/Widerstand

Institutionelle Zone

Verteidigungsregion

12. TÄGLICHE/WÖCHENTLICHE LEVELS


Automatische Linien für:

Tageshoch

Tagestief

Wochenhoch

Wochentief


Verwendet für:

✅ Ausbrüche

✅ Umkehrungen

✅ Liquidität

✅ Stop-Loss-Orders


13. INSTITUTIONELLER FILTER

Fortgeschrittener institutioneller Filter.

Unterschied:

Privater Fluss

vs institutioneller Fluss

Das System validiert:


✅ Institutionelle Cluster

✅ Volumen pro Level

✅ Dominanter Druck


📈Verwenden Sie diesen Indikator als Bestätigung für den Einstieg in Ihre Strategie. Es lohnt sich, die Bedeutung der Analyse von Fluss, Absorptionssignalen, Tape-Geschwindigkeit und Aggression in Ticks sowie das Sentiment hervorzuheben.


Zusammenfassung

KI-Zusammenfassung
Tape Reading 4.2 is an advanced trading indicator designed for institutional flow and order book analysis using tick data. It visualizes actual executed trades to reveal real-time buying and selling aggression, institutional absorption, flow acceleration, and market pressure dynamics. The system features two independent panels: a Flow Panel for operational signals including buyer/seller flow, absorption, reversals, breakouts, aggression streaks, and dynamic stop-loss/take-profit levels; and a Ladder Panel focused on the Depth of Market (DOM) ladder, institutional levels, volume by price, point of control (POC), daily/weekly highs and lows, and institutional heat maps.

Key functionalities include detection of institutional absorption (when large volume does not move price), breakout validation through volume and flow speed, reversal anticipation by exhaustion signals, and an intelligent streak system counting consecutive buy or sell ticks. The indicator also suggests lot sizing based on flow strength and institutional intensity, and applies an institutional filter distinguishing retail versus institutional flow.

Tape Reading 4.2 supports analysis of key market levels, real-time aggression, and flow reversals, transforming traditional charts into comprehensive institutional market reading tools. It is suitable for traders seeking detailed order flow insights and confirmation signals for entries based on market microstructure and volume dynamics.
Indikatorprofil
Indikatorkategorie
Orderfluss/DoM
Ausgabetyp
Visualisierung
Signale
Filter
Datenanforderungen
Tick-Daten
Volumen
DoM
Unterstützte Signale
Wendepunkt
Trendstärke
Level – Durchbrechen

Kundenbewertungen

4.5
Bewertungen: 4
5
50 %
4
50 %
3
0 %
2
0 %
1
0 %
Kundenbewertungen
July 25, 2026
Goulart is one of the more skilled Algo gurus. Delivering cutting edge DOM/visuals, hes pretty much cornered this skill above all others here. Keep up the great work my friend, I aprreciate the support that give to your clients, I'm a repeat customer...
June 24, 2026
Tape Reading Scalper v4.4 delivers an impressive institutional-style trading workspace inside cTrader. The indicator combines flow analysis, aggression tracking, absorption detection, DOM ladder visualization, sentiment analysis, and breakout validation into a single environment. Best suited for active intraday traders willing to invest time in learning order-flow concepts rather than relying on simple buy/sell signals.
May 23, 2026
Kinda useful when the chart is messy. Win rate means less without average R.
May 22, 2026
No reason to yolo this live without a few normal sessions. Win rate means less without average R.

Diskussion

Häufig gestellte Fragen (FAQ)

Key Levels
Volume
Support & Resistance
Über den cTrader Store verfügbare Produkte, einschließlich Handelsbots, Indikatoren und Plugins, werden von externen Entwicklern bereitgestellt und nur zu Informations- und technischen Zugriffszwecken verfügbar gemacht. cTrader Store ist kein Broker und erbringt keine Anlageberatung, persönlichen Empfehlungen oder eine Garantie für zukünftige Performance.

Mehr von diesem Autor

cBot
Forex
BTCUSD
+5
Intelligent negotiations and analysis!
47.3%
Rendite
3
Gewinnfaktor
cBot
XAUUSD
Scalping
Precision Scalper,XAUUSD ,Averages that functions like a multidimensional radar:
34.8%
Rendite
2.12
Gewinnfaktor
Indikator
Order BlockIndicator reversal
cBot
ATR
RSI
+4
Intelligent system, Available any instrument. Profit 12. Drawdown 1%
12.29
Gewinnfaktor
Indikator
Forex
Fair Value Gap
Volume Profile Price Period and Live VAH,VAL,POC,
cBot
RSI
MACD
+2
Chart Patterns Algo Bot
Indikator
SMC
Prop
+12
BoS ChoCH Pro,Strict Mode,False Breakout Filter,Average hit rate: 72-78%
Indikator
Forex
BTCUSD
+5
INDICATOR,LIQUIDITY POOLS,ACCURATE SIGNAL, NO DELAY,80% PROBABILITY
Indikator
PVA Volume Analysis Indicator:Price volume over trend strength and direction
cBot
AI
XAUUSD
POSITION 5000 Pips: The Ultimate Algorithm for Gold
54%
Rendite
5
Gewinnfaktor
Indikator
Signal
Indicator,combines with several strategies.MA locate trends,pullback, signal volumes, reversals, support and resistance
cBot
EMA
BTCUSD
+5
Precision Scalper Bots QUANT ,XAUUSD ,
13.8%
Rendite
3
Gewinnfaktor

Das könnte Sie auch noch interessieren

Indikator
Prop
Forex
+2
Vision - Advanced Session Indicator
Indikator
AI
ATR
+27
The "Market Temperature" Moving Average -Turn Your MA Into a Live Market Temperature Line
Indikator
Prop
Forex
+11
🧭 See when your market tends to move—by Month, Day-of-Week, or Hour-of-Day🧭
Indikator
MSS
Volume
+3
Rejection-based volume profile with tiered heat zones, POC levels and a fully draggable anchor on cTrader.
Indikator
AI
ATR
+26
The Triple Momentum indicator for cTrader is a versatile trend-following tool.
Indikator
Forex
EURUSD
+4
This is a tool to help traders open orders/close orders/modify orders quickly with just one click.
Indikator
VWAP
Volume
+4
Advanced Order Flow & Volume Profiling for cTrader. Unveil institutional footprints, Delta, and Anchored VWAPs.
Indikator
VWAP
Volume
+3
Track hidden trading activities to be on the right side of the market.
Indikator
RSI
VWAP
+5
📈 Anchored VWAP with auto High/Low, session resets, Daily VWAP & TWAP — precise, Pine-accurate port.
Indikator
Area of Interest with the power of AI to detect the market interest.
Indikator
EMA
Volume
+4
Advanced volume‑profile tool with delta, HVN/LVN zones, and precise POC‑based trade signals.
Indikator
EMA
Channel
+3
Real-time squeeze detection, dual-horizon trend scoring & institutional breakout validation HUD dashboard.
Indikator
Smart Signal Reversal Trend + Patterns
Indikator
Liquidity Grab
Liquidity Sweep
+1
CRT Sweep Tracker is an advanced panel for Candle Range Theory (CRT) traders to track HTF sweeps and manage live trades.
Indikator
RSI
Breakout
+1
📊 Liquidation Map: Potential areas where highly leveraged investors might face liquidations.
Indikator
ATR
RSI
+2
This indicator works best as a trend-confirmation tool—wait for multiple signals!
Indikator
Prop
VWAP
+15
VWAP with standard deviation bands. Fully customizable colors, periods, and multipliers for precise trading signals
Indikator
SMC
VWAP
+5
Most advanced Volume Profile Pivot Box indicator — auto pivots, volume zones, smart candle coloring & SMC trading tool.

Preis

134
Verkäufe
15.58K
Kostenlose Installationen