
Descrizione
PVA (Price-Volume Analysis) è un approccio di analisi tecnica che studia la relazione tra il prezzo e il volume di scambio di un asset finanziario. L'idea centrale dietro il PVA è che il volume di scambio possa fornire informazioni importanti sulla forza e la direzione di una tendenza, aiutando i trader a prendere decisioni più informate.
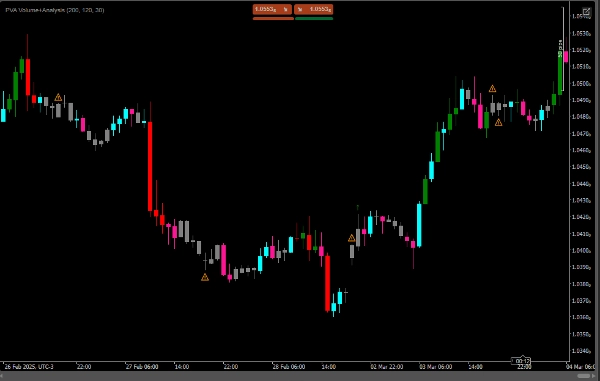
-Aumento del volume con prezzo in crescita: Indica una forte tendenza al rialzo, e viene mostrato un simbolo verde (freccia verso l'alto).
-Aumento del volume con prezzo in diminuzione: Indica una forte tendenza al ribasso, e viene mostrato un simbolo rosso (freccia verso il basso).
-Diminuzione del volume con prezzo in crescita: Indica che la tendenza al rialzo potrebbe perdere forza, e viene mostrato un avviso arancione (simbolo di avvertimento).
-Diminuzione del volume con prezzo in diminuzione: Indica che la tendenza al ribasso potrebbe perdere forza, e viene mostrato anche un avviso arancione (simbolo di avvertimento).
-Se il volume diminuisce in un movimento verso l'alto o verso il basso, viene disegnato un segno di avviso (⚠️).
Riepilogo
- A green up arrow appears when volume increases alongside rising prices, indicating a strong uptrend.
- A red down arrow signals a strong downtrend when volume increases as prices fall.
- An orange warning symbol alerts when volume decreases during rising or falling prices, suggesting the current trend may be weakening.
- A general alert mark (⚠️) is displayed if volume declines during either upward or downward price movements.
This indicator assists traders by highlighting the interplay between price and volume, offering insights into the momentum behind market trends. It is designed for use in technical analysis to support more informed trading decisions.
Recensioni dei clienti
5 | 100 % | |
4 | 0 % | |
3 | 0 % | |
2 | 0 % | |
1 | 0 % |


