
Descrizione
L'indicatore MAGIC BLOCK STRATEGY combina due approcci principali all'analisi di mercato:
Rilevamento degli Order Block:
Identifica aree di supporto e resistenza basate su massimi e minimi non infranti all'interno di un periodo di lookback.
Genera segnali di acquisto quando il prezzo chiude sopra un minimo non infranto.
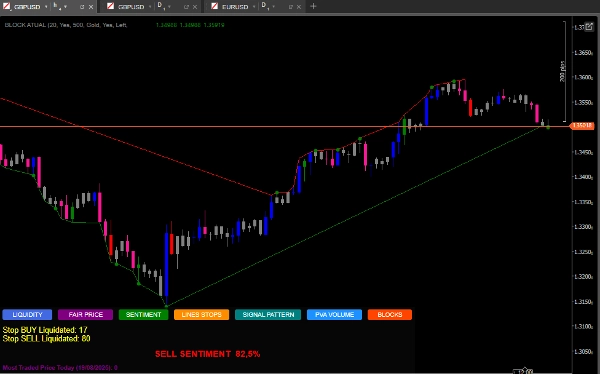
Genera segnali di vendita quando il prezzo chiude sotto un massimo non infranto.
Analisi della Liquidità:
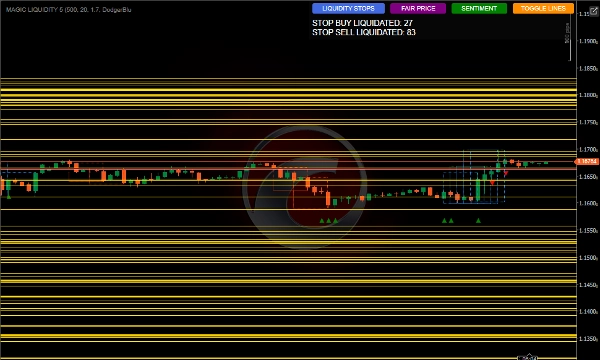
Rileva aree di pool di liquidità dove potrebbero essere concentrati gli stop loss.
Monitora l'attivazione degli stop di acquisto e vendita.
Calcola il sentiment di mercato basato sulla distribuzione della liquidità.
Identifica il prezzo equo più scambiato.
Come Usare per i Migliori Risultati
Configurazione Iniziale
Periodo di Lookback: Regola il parametro Periodo di Lookback in base al timeframe su cui stai operando, valori più alti per timeframe più lunghi.
Numero di Candele per l'Analisi: Mantienilo a 500 per un'analisi robusta o riducilo per reazioni più rapide.
Colore del Pool di Liquidità: Scegli un colore che risalti sul tuo grafico.
Interpretazione dei Segnali
Segnali degli Order Block:
Punti verdi: segnali di acquisto quando il prezzo chiude sopra un minimo imbattuto.
Punti rossi: segnali di vendita quando il prezzo chiude sotto un massimo imbattuto.
Pool di Liquidità:
Linee orizzontali mostrano aree di liquidità, potenziali obiettivi o punti di inversione.
Monitora la relazione tra la liquidità sopra/sotto il prezzo attuale.
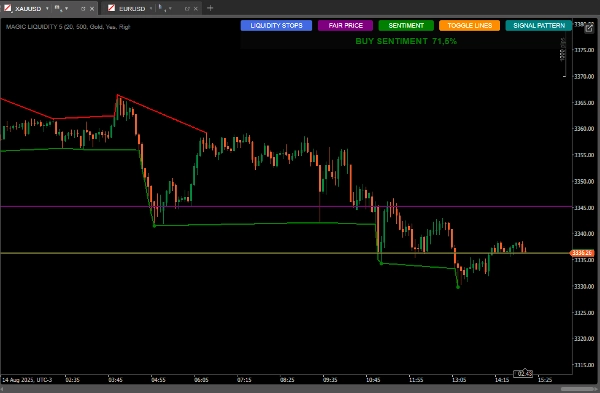
Sentiment di Mercato:
Usa il pulsante SENTIMENT per vedere la direzione prevalente e la fiducia.
Un sentiment di acquisto con alta fiducia suggerisce una crescita continua. Un sentiment di vendita ad alta fiducia suggerisce una continuazione ribassista.
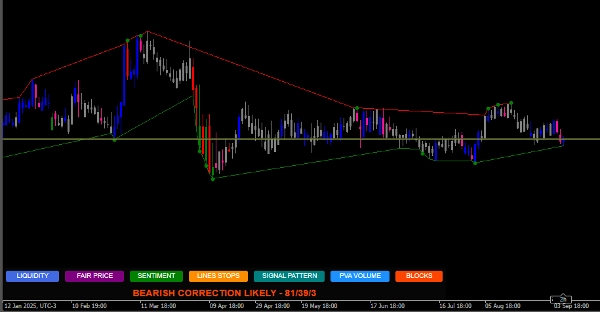
Pattern di Candele:
Il pulsante SIGNAL PATTERN analizza e
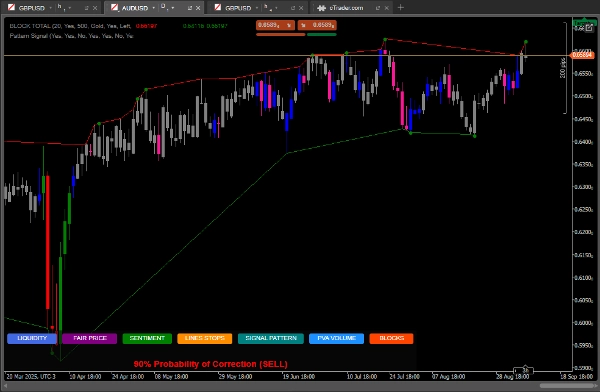
Mostra le probabilità di correzione basate sul rapporto quantitativo
Prezzo Equo Più Scambiato:
Il pulsante PRICE mostra il livello di prezzo con il volume più alto della giornata.
Può agire come una calamita per i prezzi o come supporto/resistenza.
Strategie di Utilizzo
Strategia Conservativa:
Operare solo quando i segnali degli order block coincidono con il sentiment prevalente.
Usa i pool di liquidità come obiettivi di take-profit.
Strategia Aggressiva:
Anticipa le inversioni quando il prezzo si avvicina ai pool di liquidità con molti stop accumulati.
Usa le divergenze tra sentiment e azione del prezzo per operazioni controtrend.
Conferma Aggiuntiva:
Confronta con il pattern di candele mostrato dall'indicatore.
Verifica se il prezzo equo è nelle vicinanze come area di interesse.
Gestione del Rischio.
Stop-Loss:
Posiziona sotto l'order block più recente per gli acquisti
Posiziona sopra l'order block più recente per le vendite
Take-Profit:
Obiettivi nei pool di liquidità vicini
Considera il rapporto di liquidità sopra/sotto per impostare gli obiettivi
Suggerimenti Avanzati
Usa il pulsante TOGGLE LINES per disabilitare le linee di liquidità quando il grafico diventa affollato
Monitora il conteggio degli stop liquidati per valutare la forza del movimento
Il prezzo equo è particolarmente utile nei mercati laterali come supporto/resistenza dinamico
Combina con altri indicatori per conferma volume, medie mobili
SIGNAL PATTERN DISPONIBILE NEL TIMEFRAME D1.
https://ctrader.com/pt/products/1725?u=Goulart
https://ctrader.com/pt/products/1386?u=Goulart
Riepilogo
The indicator also analyzes liquidity pools, highlighting areas where stop losses may accumulate and monitoring the activation of buy and sell stops. It calculates market sentiment based on liquidity distribution and identifies the most traded price level of the day, which can act as dynamic support or resistance.
Users can customize parameters such as lookback period and number of candles for analysis to suit different timeframes and trading styles. Visual signals include green and red dots for buy and sell order block signals, horizontal lines for liquidity pools, and sentiment indicators showing prevailing market direction and confidence.
The tool supports conservative strategies that align order block signals with sentiment and use liquidity pools as profit targets, as well as aggressive strategies that anticipate reversals near liquidity pools and exploit divergences between sentiment and price action. Additional features include candlestick pattern correction probabilities and options to toggle liquidity lines for chart clarity. Risk management guidance suggests placing stop-loss orders relative to recent order blocks and setting take-profit targets near liquidity pools.


