
Penerangan
Objektif Utama:
Peta pengagihan volum mengikut tahap harga untuk mengenal pasti:
Kawasan kecairan tinggi
Kawasan kecairan rendah
Ketidakseimbangan antara pembeli dan penjual
Penunjuk ini sangat berkuasa untuk memahami struktur pasaran dan mengenal pasti kawasan berkemungkinan tinggi untuk operasi! 🎯
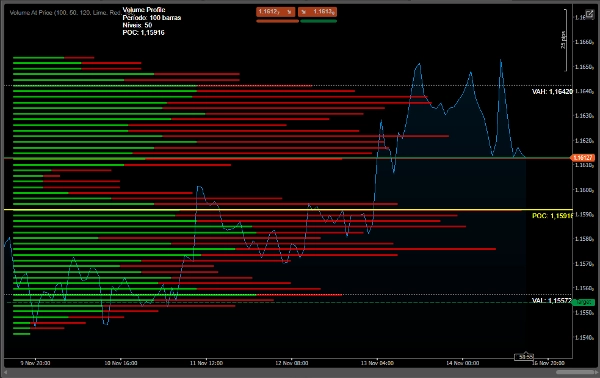
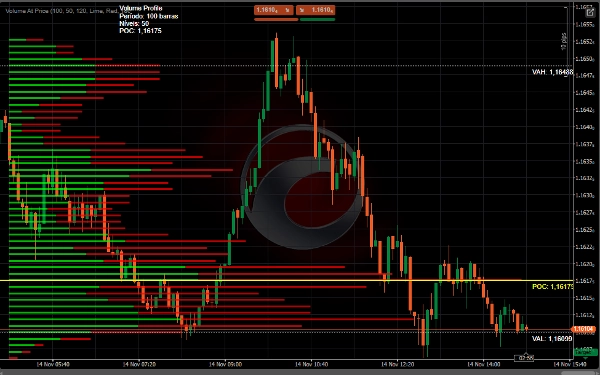
1. POC (Titik Kawalan)
Linha Amarela - Harga dengan volum dagangan tertinggi
Kawasan kecairan dan harga terbesar
Sokongan/rintangan semula jadi
2. Kawasan Nilai
Garis putih - Kawasan di mana 70% volum didagangkan
VAH (Nilai Kawasan Tinggi) - Had atas
VAL (Nilai Kawasan Rendah) - Had bawah
Zon keseimbangan pasaran
3. Teras Volum
🟢 Hijau - Volum Pembelian Dominan
🔴 Merah - Volum penjualan dominan
Panjang Bar = Intensiti Volum
📊 Gunakan Strategi
1. Pengenalpastian Sokongan dan Rintangan
• POC berfungsi sebagai sokongan/rintangan dinamik
• Kawasan Nilai menentukan zon keseimbangan
• Tepi profil S/R penting
2. Analisis Pecahan
• Pecah di atas VAH → Trend naik
• Pecah di bawah VAL → Trend turun
• Volum tidak pecah mengesahkan pergerakan
3. Titik Masuk
• Beli: Uji semula VAL dengan volum pembeli
• Jual: Uji semula VAH dengan volum penjual
• Fade: Operasi bertentangan dengan ekstrem profil
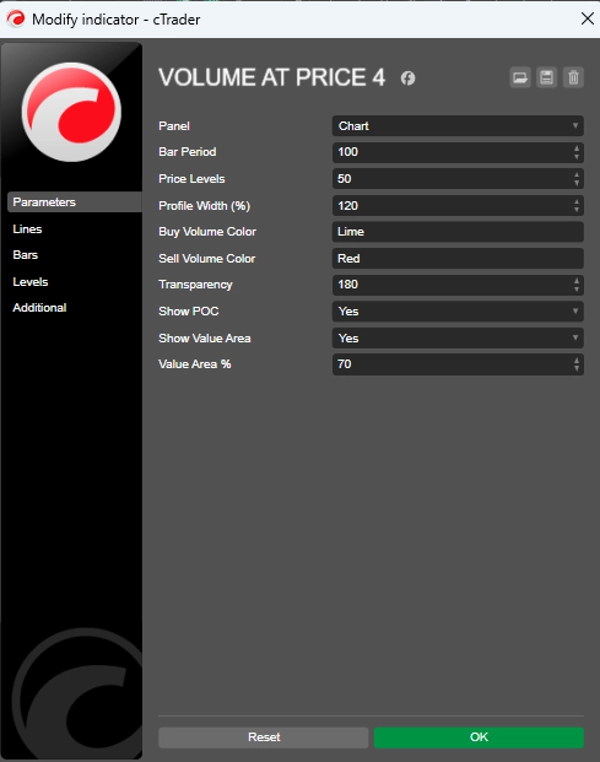
⚙️ Konfigurasi Disyorkan
Untuk Dagangan Harian
csharp
Tempoh = 50-100
Tahap Harga = 50
Lebar Profil = 120%
Peratus Kawasan Nilai = 70
Untuk Dagangan Swing
csharp
Tempoh = 100-200
Tahap Harga = 80
Lebar Profil = 150%
Peratus Kawasan Nilai = 70
✅ KELEBIHAN:
Mengenal pasti sokongan/rintangan dinamik
Menunjukkan niat pasaran (volum)
Mendedahkan kawasan kecairan penting
Visualisasi jelas ketidakseimbangan
Pengiraan tik volum semasa
Ringkasan
- Point of Control (POC): The price level with the highest traded volume, acting as a dynamic support or resistance.
- Value Area: The price range where 70% of volume is traded, defined by Value Area High (VAH) and Value Area Low (VAL), representing market balance zones.
- Volume Cores: Colored bars indicating dominant buying (green) or selling (red) volume, with bar length reflecting volume intensity.
The indicator supports strategies like identifying support and resistance levels, breakout analysis (trend direction based on VAH and VAL breaks), and entry points (buy near VAL with buyer volume, sell near VAH with seller volume, or fade at profile extremes).
Recommended settings vary by trading style: for day trading, shorter periods and narrower profiles; for swing trading, longer periods and wider profiles. This tool aids in visualizing liquidity, market intent, and volume imbalances to inform trading decisions.
Ulasan pelanggan
5 | 0 % | |
4 | 50 % | |
3 | 50 % | |
2 | 0 % | |
1 | 0 % |


