
Descrizione
Completa le tue strategie con questo indicatore di segnale👇🏻
https://ctrader.com/pt/products/1560?u=Goulart
✔Caratteristiche dell'indicatore
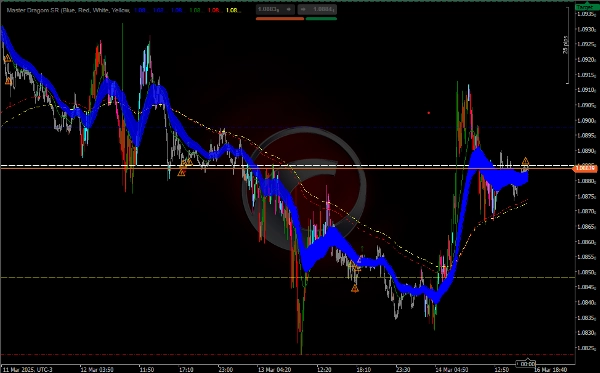
Supporto e Resistenza (SR):
L'indicatore traccia linee orizzontali per i livelli di supporto e resistenza giornalieri, settimanali e mensili.
Puoi abilitare o disabilitare ogni livello (apertura, chiusura, massimo e minimo) secondo necessità.
Medie Mobili Esponenziali (EMA):
L'indicatore calcola più EMA (50, 25, 200 e 233 periodi) per aiutare a identificare le tendenze e potenziali aree dinamiche di supporto/resistenza.
Le EMA sono tracciate sul grafico con colori diversi per una facile visualizzazione.
Analisi del Volume (PVAVolumeAnalysis):
L'indicatore analizza il volume per identificare potenziali inversioni o continuazioni di tendenza.
Evidenzia le barre con volume superiore alla media e segnala cambiamenti significativi nel volume con icone (↑, ↓, ⚠️).
Colorazione delle Barre:
Le barre sono colorate in base al volume e alla direzione del prezzo (su o giù), il che aiuta a identificare la forza della tendenza.
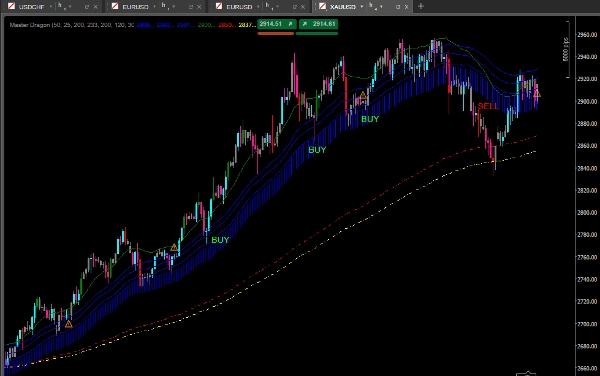
Analisi della Tendenza con le EMA:
Usa le EMA per identificare la direzione della tendenza:
Se il prezzo è sopra le EMA (specialmente le EMA 200 e 233), la tendenza è al rialzo.
Se il prezzo è sotto le EMA, la tendenza è al ribasso.
L'area tra il massimo e il minimo della EMA 50 può essere usata come zona di interesse per potenziali inversioni o continuazioni.
Analisi del Volume:
Osserva le icone e i colori delle barre per identificare cambiamenti nel volume:
Volume alto con prezzo in aumento (↑): Conferma di una tendenza al rialzo.
Volume alto con prezzo in diminuzione (↓): Conferma di una tendenza al ribasso.
Volume basso con prezzo in aumento o diminuzione (⚠️): Possibile inversione.
Combinazione dei Segnali:
Combina i segnali di volume, EMA e livelli SR per prendere decisioni di ingresso o uscita.
Ad esempio, se il prezzo è vicino a un livello di resistenza e il volume sta diminuendo, potrebbe essere un segnale di inversione.
Strategia Suggerita
Strategia di Tendenza con Conferma del Volume
Identifica la Tendenza:
Usa le EMA (200 e 233) per determinare la tendenza principale.
Se il prezzo è sopra le EMA, considera solo acquisti.
Se il prezzo è sotto le EMA, considera solo vendite.
Aspetta un Ritracciamento:
Aspetta che il prezzo ritorni a una EMA di periodo più breve (50 o 25) o a un livello SR.
Conferma con il Volume:
Verifica se il volume sta aumentando nella direzione della tendenza (↑ per acquisti, ↓ per vendite).
Le MA individuano tendenze, ritracciamenti, segnali di volume, inversioni, supporto e resistenza.
Se il volume sta diminuendo (⚠️), evita di entrare o considera un'inversione.
Ingresso:
Acquista quando il prezzo è sopra le EMA e vicino a un livello di supporto, con il volume che conferma la tendenza al rialzo.
Vendi quando il prezzo è sotto le EMA e vicino a un livello di resistenza, con il volume che conferma la tendenza al ribasso.
Uscita:
Usa i livelli SR o le EMA come obiettivi o punti di uscita.
Ad esempio, chiudi o vendi quando raggiunge un livello di supporto.
Riepilogo
Volume analysis is integrated to detect potential trend reversals or continuations by highlighting bars with above-average volume and signaling significant volume changes using icons (↑ for rising volume confirming uptrends, ↓ for falling volume confirming downtrends, and ⚠️ for low volume indicating possible reversals). Bars are color-coded based on volume and price direction to visually represent trend strength.
Traders can combine signals from volume, EMAs, and support/resistance levels to make informed entry and exit decisions. A suggested strategy involves identifying the main trend using the 200 and 233 EMAs, waiting for pullbacks to shorter EMAs or support/resistance levels, and confirming with volume signals before entering trades. Exit points can be set at support/resistance levels or EMA lines. This indicator is suitable for enhancing trend, pullback, volume, reversal, and support/resistance analysis in various trading strategies.
Recensioni dei clienti
5 | 100 % | |
4 | 0 % | |
3 | 0 % | |
2 | 0 % | |
1 | 0 % |


