
Descrizione
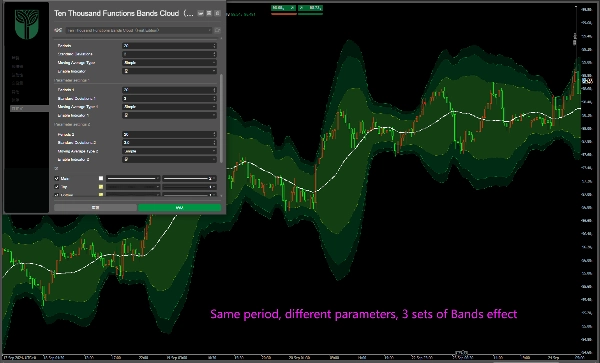
Gruppi regolari di 3 bande:
periodo:20
Deviazioni:2.0;3.0; 3.5;
Potenzionato con sfondo cloud!
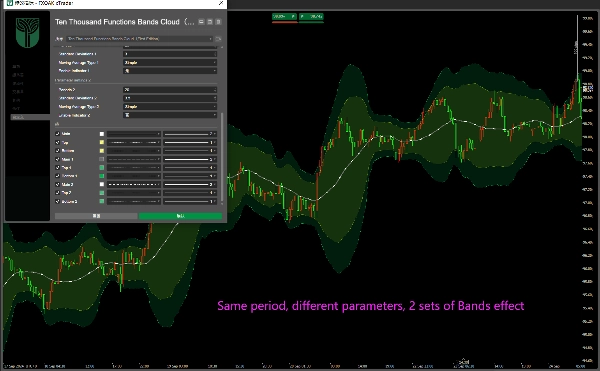
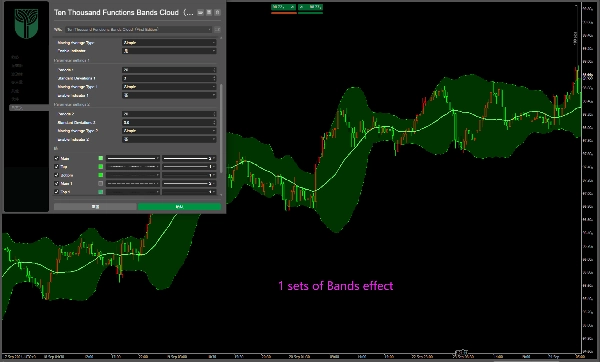
Puoi chiudere o aprire uno o due gruppi; e diversi parametri possono essere modificati e impostati!
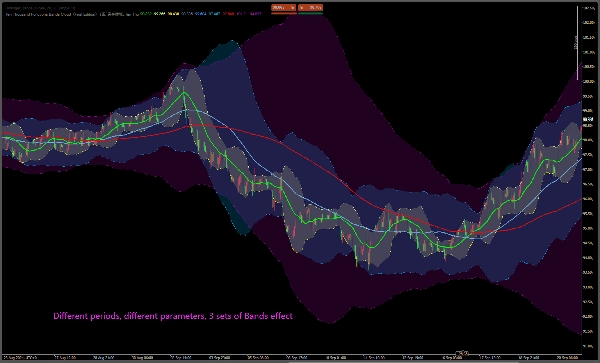
Può anche essere modificato in altri valori, come 2.0:20, 60, 144 bande;
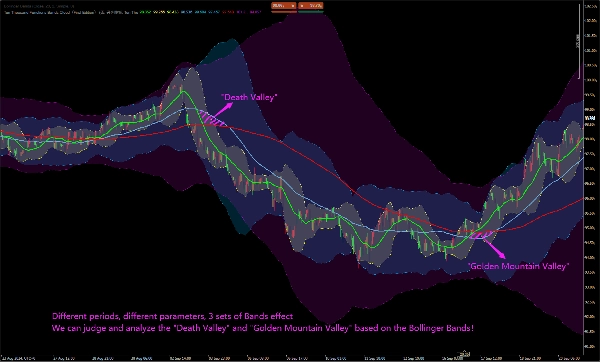
La traccia centrale delle bande è uguale alla media mobile, che sono le medie mobili a 20, 60 e 144!
Possiamo giudicare e analizzare la "Valle della Morte" e la "Valle della Montagna d'Oro" basandoci sulla traccia centrale delle Bande di Bollinger!
Gruppi regolari di 3 bande:
Periodo:20
Deviazione:2.0;3.0; 3.5;
Supporto sfondo cloud!
Puoi chiudere o aprire uno o due gruppi; e puoi modificare e impostare diversi parametri!
Può anche essere modificato in altri valori, come 2.0:20, 60, 144 bande di Bollinger;
La traccia centrale delle bande è uguale alla media mobile, cioè le medie mobili a 20, 60 e 144!
Possiamo giudicare e analizzare la "Valle della Morte" e la "Valle della Montagna d'Oro" basandoci sulla traccia centrale delle bande di Bollinger...
Gruppi standard di 3 bande di Bollinger (Bands): periodo: 20; valori di deviazione: 2.0; 3.0; 3.5; supporto per sfondo cloud! È possibile attivare/disattivare uno o due gruppi a piacere; inoltre, è possibile modificare e impostare i vari parametri. Può anche essere modificato in altri valori. Ad esempio, impostare bande di Bollinger con deviazione 2.0 e periodi 20, 60, 144. La linea centrale delle bande di Bollinger è uguale alla media mobile, cioè le medie mobili a 20, 60 e 144 periodi. Basandosi sulla linea centrale delle bande di Bollinger, è possibile giudicare e analizzare fenomeni come la "Valle della Morte" e la "Valle della Montagna d'Oro".
Стандартные 3 группы Бандов (Полос Боллинджера): Период: 20; Отклонение: 2,0; 3,0; 3,5; Поддержка облачного фона! Вы можете отключить или включить любую одну или две группы; кроме того, вы можете изменять и настраивать различные параметры! Его также можно изменить на другие значения, например, Боллинджеры с отклонением 2,0 и периодами 20, 60, 144; Средняя линия Бандов равна скользящей средней, то есть скользящим средним с периодами 20, 60 и 144! Мы можем определять и анализировать такие явления, как «Мёртвая долина» и «Золотая долина», на основе средней линии 。
Riepilogo
Recensioni dei clienti
5 | 100 % | |
4 | 0 % | |
3 | 0 % | |
2 | 0 % | |
1 | 0 % |


