
Opis
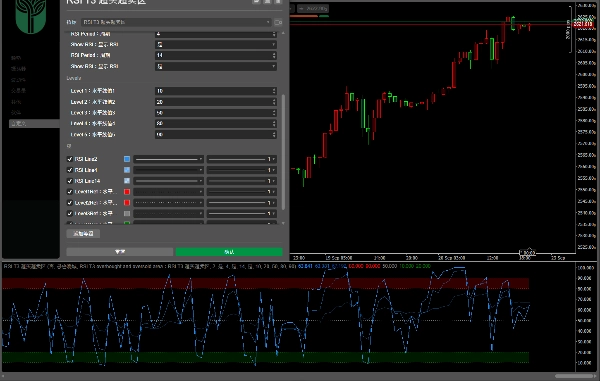
Trójparametrowy RSI z obszarami wykupienia/wyprzedania
(Parametry oraz strefy wykupienia/wyprzedania można regulować niezależnie; każdą linię cyklu można włączać lub wyłączać osobno), co ułatwia obserwację rezonansu wielocyklicznego:
• Spójność trendu:
RSI dla krótkiego, średniego i długiego cyklu porusza się w tym samym kierunku. Jeśli RSI krótkiego cyklu pozostaje powyżej RSI średniego i długiego cyklu, wskazuje to na trend wzrostowy; w przeciwnym razie oznacza trend spadkowy.
• Dywergencja i odwrócenie:
Gdy cena osiąga nowe maksimum/minimum, ale RSI krótkiego cyklu nie podąża za tym, a RSI średniego i długiego cyklu słabnie/odnawia się, sygnalizuje to potencjalną korektę/odbiicie.
• Potwierdzenie wykupienia/wyprzedania:
Gdy RSI pojedynczego cyklu wchodzi w strefę wykupienia lub wyprzedania, ocena powinna być łączona z innymi cyklami; jeśli wiele cykli jednocześnie wchodzi w strefę wykupienia lub wyprzedania, sygnał jest bardziej wiarygodny.
• Rezonans cykli:
Gdy RSI wielu cykli wysyła ten sam sygnał (np. wszystkie przebijają linię środkową 50), prawdopodobieństwo kontynuacji lub odwrócenia trendu jest większe, co może wspomagać podejmowanie decyzji.
带超买超卖区域的三参数 RSI
(可自主调整参数与超买超卖区域,支持单独开关各周期线),便于观察多周期共振:
•趋势一致性:
短、中、长周期 RSI 同向运行,短周期在中长周期上方为多头趋势;反之则为空头趋势。
•背离与反转:
价格创新高 / 低但短周期 RSI 未同步,且中长周期 RSI 走弱 / 回升,提示可能回调 / 反弹。
•超买超卖确认:
单周期超买超卖时,需结合其他周期判断;多周期同时超买超卖,信号更可靠。
•周期共振:
多周期 RSI 同发信号(如均突破 50 中轴线),趋势延续或反转的概率更高,可辅助决策。
Podsumowanie
- Trend Consistency: Identifies bullish or bearish trends based on the relative positions of short-, medium-, and long-cycle RSIs.
- Divergence and Reversal Signals: Detects potential pullbacks or rallies when price movements diverge from short-cycle RSI behavior while medium- and long-cycle RSIs weaken or recover.
- Overbought/Oversold Confirmation: Enhances signal reliability by combining overbought or oversold conditions across multiple RSI cycles.
- Cycle Resonance: Highlights stronger trend continuation or reversal probabilities when multiple RSI cycles simultaneously signal, such as crossing the 50 midline.
This indicator supports detailed momentum analysis by integrating multi-timeframe RSI data, aiding traders in decision-making through comprehensive trend and reversal insights.
Opinie klientów
5 | 0 % | |
4 | 100 % | |
3 | 0 % | |
2 | 0 % | |
1 | 0 % |


