
Descrizione
- Calcola le **Bande di Bollinger** 📊 basate sulla Media Mobile Semplice (SMA) e sulla deviazione standard del prezzo di chiusura.
- Calcola i **Canali di Keltner** 📈 utilizzando una media mobile e il true range o l'intervallo tra massimi e minimi.
- Successivamente, l'indicatore misura il **momentum** ⚡ calcolando la differenza tra il prezzo di chiusura attuale e la media dei recenti massimi e minimi, mostrando un **istogramma**:
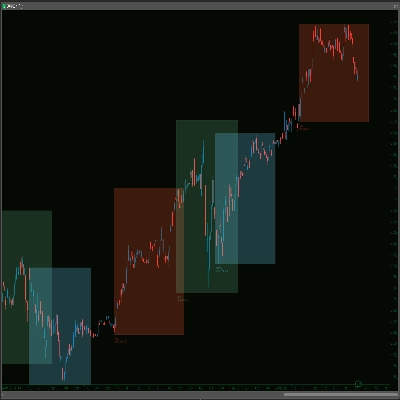
- **Verde** per momentum positivo 📈.
- **Rosso** per momentum negativo 📉.
Questo istogramma aiuta a visualizzare la forza e la direzione dei movimenti di mercato, facilitando l'individuazione di potenziali trend o cambiamenti nella dinamica del mercato.
🔥 Pinescritlabs
Indicatori Ctrader Store: 🤖Pinescritlabs Ctrader Store cBots:
Fair Value Gap Sessions Gold & BTC Breakout Session Pivots(nuovo)
Dynamic Market Structure
Analisi dei Punti di Inversione
Fibonacci Linear
Regressione Multi-timeframe
Multi-Level Candle Bias
Tracker
Auto Support and
Resistance Trend Lines
Riepilogo
Recensioni dei clienti
5 | 100 % | |
4 | 0 % | |
3 | 0 % | |
2 | 0 % | |
1 | 0 % |


![Logo di "[Stellar Strategies] Smart ADX"](https://cdn.ctrader.com/image/webp/af13b084-b6f6-41db-b7bc-c7e688b57b05_36929)


