
Descrizione
Panoramica
Swing Flow è un indicatore avanzato di trend following che si visualizza direttamente sul grafico dei prezzi, offrendo un segnale visivo pulito e intuitivo — simile nello stile al classico SuperTrend — ma basato su una logica sottostante fondamentalmente diversa e più sofisticata.
Mentre gli indicatori di trend standard reagiscono a ogni candela, Swing Flow ancora i suoi calcoli a punti di swing di mercato significativi, producendo una linea che riflette veramente il trend dominante con molto meno rumore e falsi segnali.
Come Funziona (Senza Rivelare la Formula)
Swing Flow identifica massimi e minimi pivot significativi nel mercato — i naturali punti di inversione dove il prezzo si è effettivamente invertito. Costruisce quindi un livello medio dinamico e due bande adattive (superiore e inferiore) attorno a questi pivot, applicando una levigatura aggiustata per la volatilità per filtrare le fluttuazioni a breve termine.
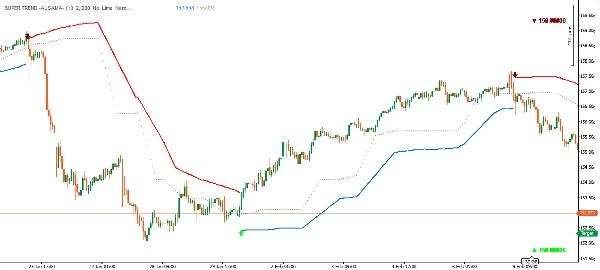
Il risultato è una singola linea di trend visualizzata sul grafico:
- 🟢 Linea verde sotto il prezzo → Trend rialzista (funziona come supporto dinamico)
- 🔴 Linea rossa sopra il prezzo → Trend ribassista (funziona come resistenza dinamica)
Quando il trend cambia, la linea cambia lato e colore — esattamente come SuperTrend — rendendolo immediatamente evidente e azionabile.
Componenti dell'Indicatore
Descrizione del Componente
Linea Principale del Trend
La linea segnale primaria — verde sotto il prezzo in trend rialzista, rossa sopra in trend ribassista
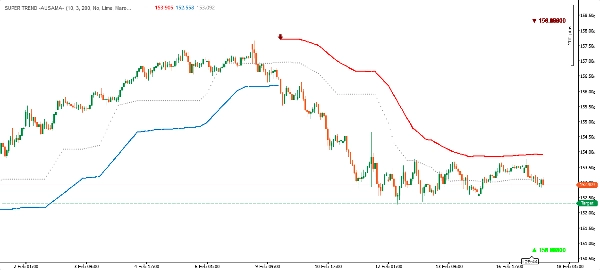
Banda Superiore
Livello di resistenza dinamica, mostrato durante le fasi ribassiste
Banda Inferiore
Livello di supporto dinamico, mostrato durante le fasi rialziste
Linea Media
La linea centrale adattiva derivata dalla struttura di mercato
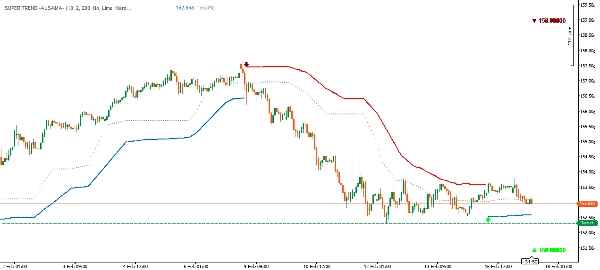
Indicatori di Segnale
Frecce su/giù con etichette di prezzo ad ogni inversione di trend
Etichette Pivot (opzionale)
Indicatori a forma di diamante ai massimi e minimi di swing (possono essere attivati/disattivati)
Vantaggi Chiave
✅ Logica Basata sulla Struttura
A differenza della maggior parte degli indicatori di trend che guardano solo all'azione recente del prezzo, Swing Flow si basa su veri punti pivot di swing — i livelli che il mercato stesso ha già convalidato come significativi. Questo rende il segnale di trend fondamentalmente più significativo.
✅ Filtro di Volatilità Adattivo
Le bande si adattano automaticamente alla volatilità di mercato corrente, restringendosi in condizioni calme e allargandosi durante periodi volatili. Questo riduce i falsi segnali senza richiedere regolazioni manuali.
✅ Visualizzazione Pulita in Stile SuperTrend
Nonostante la sua logica avanzata, l'output visivo è pulito e familiare. Una linea sul grafico — verde sotto, rossa sopra. Nessun ingombro. Immediatamente leggibile su qualsiasi timeframe.
✅ Segnali di Entrata Precisi
Ogni cambiamento di trend è segnato con una freccia direzionale e il prezzo di chiusura esatto alla barra di inversione, fornendo un chiaro punto di riferimento per le entrate.
✅ Personalizzazione Completa dei Colori
Sia i colori per il trend rialzista che per quello ribassista sono completamente personalizzabili per adattarsi al tuo stile di grafico o preferenze personali.
✅ Funziona su Tutti i Mercati e Timeframe
Forex, indici, materie prime, crypto — l'indicatore si adatta naturalmente a qualsiasi strumento e timeframe grazie al suo design consapevole della volatilità.
Come Usarlo
Trend Following: Segui il trend nella direzione della linea — acquista quando la linea è verde (sotto il prezzo), vendi o resta fuori quando la linea è rossa (sopra il prezzo).
Supporto e Resistenza Dinamici: La banda attiva funge da livello di supporto (rialzista) o resistenza (ribassista) in tempo reale. Il ritorno del prezzo alla linea senza superarla è un segnale di continuazione.
Segnali di Entrata: Le frecce (▲ / ▼) indicano un cambiamento di trend confermato. Possono essere usate come trigger di entrata, specialmente se allineate con altre confluences sul tuo grafico.
Riferimento Pivot (opzionale): Abilita "Massimi e Minimi" per visualizzare i punti pivot di swing che l'indicatore usa internamente. Utile per comprendere la struttura di mercato a colpo d'occhio.
Swing Flow vs. SuperTrend Standard
CaratteristicaSuperTrend StandardSwing Flow
Base di calcolo
Ogni singola candela
Pivot di swing di mercato convalidati
Rumore del segnale
Maggiore — reagisce a ogni barra
Minore — ancorato alla struttura
Falsi segnali
Più comuni in mercati agitati
Significativamente ridotti
Adattabilità
Moltiplicatore ATR fisso
Bande levigate in base alla volatilità
Stile visivo
Linea singola
Linea singola + bande + livello medio
Conferma di entrata
Cambio di colore
Freccia + etichetta prezzo all'inversione
Visibilità dei pivot
Nessuna
Indicatori pivot opzionali
In breve: Swing Flow sembra SuperTrend, ma pensa come un trader di price action.
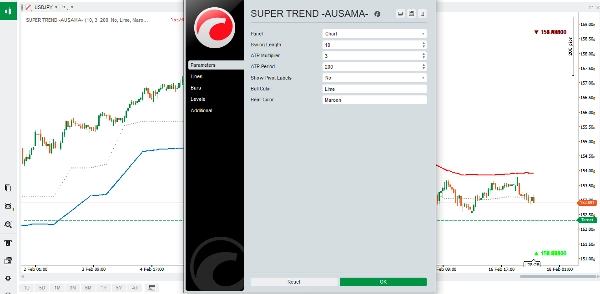
Parametri di Input
ParametroPredefinitoDescrizione
Lunghezza Swing
10
Controlla la sensibilità del rilevamento dei pivot
Moltiplicatore ATR
2.0
Larghezza della banda relativa alla volatilità
Periodo ATR
200
Periodo di riferimento per la misurazione della volatilità
Mostra Etichette Pivot
Disattivato
Attiva/disattiva gli indicatori di massimi/minimi di swing sul grafico
Colore Rialzista
Lime
Colore per il trend rialzista
Colore Ribassista
Marrone scuro
Colore per il trend ribassista
Consigli per i Migliori Risultati
- Lunghezza Swing più bassa (5–8): Più sensibile, più segnali — adatta per scalping o trading attivo.
- Lunghezza Swing più alta (14–20): Meno segnali, ma di qualità superiore — adatta per swing trading o trading di posizione.
- Aumenta il Moltiplicatore ATR in mercati altamente volatili (es. crypto) per evitare falsi cambi di segnale.
- Diminuisci il Moltiplicatore ATR in mercati stabili e trend per segnali più precisi.
- Meglio usato con conferma del trend da timeframe superiori.
Swing Flow — Dove la struttura di mercato incontra la chiarezza del trend.


![Logo di "[Hamster-Coder] Moving Average MTF"](https://cdn.ctrader.com/image/webp/b11b98b1-194d-4b8e-b00e-d611826ad159_31226)


