
설명
내재 재귀 값 지표
개요
내재 재귀 값은 여러 기간에 걸친 재귀 상대 강도 계산을 활용하여 내재된 시장 추세를 식별하는 맞춤형 지표입니다. 추세 강도가 임계 수준에 도달하는 주요 가격 수준을 결정하여 잠재적 반전 및 추세 확인에 대한 통찰을 제공합니다. 내재 재귀 값의 개념은 시장 모멘텀과 추세 강도가 여러 계층의 가격 행동 분석을 적용하여 재귀적으로 정제될 수 있다는 아이디어에 기반합니다. 이 재귀적 접근법은 전통적인 가격 기반 지표가 간과할 수 있는 깊이 있는 강세 및 약세 조건을 식별하는 데 도움을 줍니다.
강세 및 약세 거래 구역
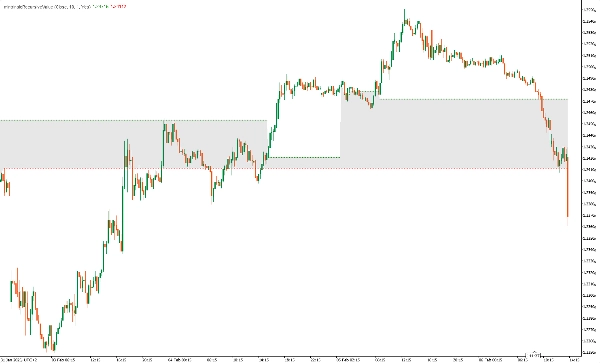
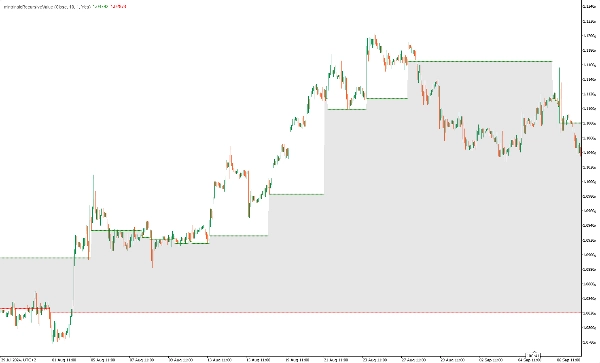
- 강세 거래 구역: 내재 재귀 값이 지속적인 강세 강도를 확인할 때 형성되는 구역입니다. 모든 재귀 상대 강도 계산이 균형 이상에서 지속적인 값을 나타낼 때 발생하며, 강한 상승 모멘텀을 시사합니다. 강세 거래 구역은 트레이더가 잠재적 롱 진입 지점과 가격이 계속 상승할 수 있는 동적 지지 영역을 식별하는 데 도움을 줍니다.
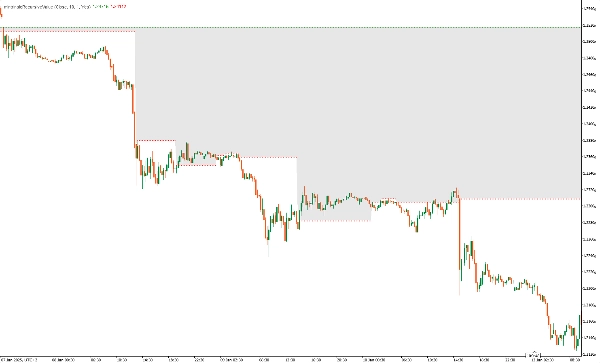
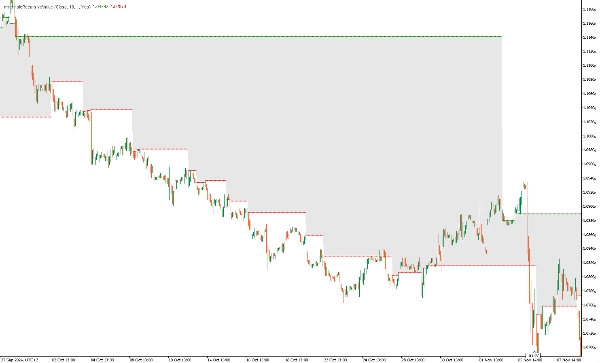
- 약세 거래 구역: 내재 재귀 값이 지속적인 약세 강도를 식별할 때 설정되는 구역입니다. 모든 재귀 상대 강도 값이 균형 이하일 때 진행 중인 하락 추세를 신호하며, 트레이더에게 숏 진입 기회를 제공하고 가격이 계속 하락할 수 있는 동적 저항 수준을 정의합니다.
지표 출력
- outIntrinsicRecursiveLong : 강세 강도가 감지될 때 내재 롱 레벨을 표시합니다.
- outIntrinsicRecursiveShort: 약세 강도가 감지될 때 내재 숏 레벨을 표시합니다.
사용법
- 추세 확인: 모든 상대 강도 기간이 일치할 때 강한 강세 또는 약세 추세를 식별하는 데 도움을 줍니다.
- 반전 감지: 내재 값이 변할 때 잠재적 전환점을 신호합니다.
- 지지 및 저항 수준: 내재 값은 동적 지지 및 저항 수준으로 작용합니다.
예제 거래 전략
- 롱 진입: 내재 롱 레벨이 설정되고 가격 행동이 강세 모멘텀을 확인할 때 롱 거래에 진입합니다. 이는 가격이 균형 값(지표의 녹색 구성 요소) 이상임을 의미합니다.
- 숏 진입: 내재 숏 레벨이 설정되고 가격 행동이 약세 모멘텀을 확인할 때 숏 거래에 진입합니다. 이는 가격이 균형 값(지표의 빨간 구성 요소) 이하임을 의미합니다.
- 종료 전략: 트레일링 스톱 또는 내재 레벨 소멸 시 거래를 종료합니다.
참고
- 이 지표는 추세 추종 전략을 위해 설계되었으며 추세 시장에서 가장 잘 작동합니다.
- 모멘텀 지표와 같은 다른 지표와 결합하여 거래 확인 트리거로 사용할 수 있습니다.
결론
내재 재귀 값 지표는 재귀 상대 강도 계산을 사용하여 추세 분석을 향상하려는 트레이더에게 강력한 도구입니다. 높은 확률의 추세를 가진 주요 가격 수준을 식별함으로써 이 지표는 시장 방향과 잠재적 거래 기회에 대한 귀중한 통찰을 제공합니다.
요약
AI 요약
The Intrinsic Recursive Value Indicator is a custom trading tool that applies recursive relative strength calculations across multiple periods to identify intrinsic market trends. It highlights key price levels where trend strength reaches critical thresholds, aiding in the detection of potential reversals and trend confirmations. This recursive method refines market momentum analysis by layering price action evaluations, revealing deep bullish or bearish conditions often missed by traditional indicators.
The indicator defines Bullish and Bearish Trade Zones: the Bullish Trade Zone signals sustained upward momentum when all recursive strength values exceed equilibrium, suggesting potential long entry points and dynamic support levels. Conversely, the Bearish Trade Zone indicates ongoing downtrends when values fall below equilibrium, identifying short entry opportunities and dynamic resistance levels.
Outputs include intrinsic long and short levels that display when bullish or bearish strength is detected. Use cases encompass trend confirmation, reversal detection, and identification of dynamic support and resistance levels. An example strategy involves entering long trades when intrinsic long levels align with bullish price action and short trades when intrinsic short levels coincide with bearish momentum, with exits managed via trailing stops or disappearance of intrinsic levels.
Designed primarily for trend-following strategies in trending markets, this indicator can be combined with other momentum tools for trade confirmation.
지표 프로필
고객 리뷰
0.0
리뷰: 0
고객 리뷰
이 상품에 대한 리뷰가 아직 없습니다. 이미 사용해 보셨나요? 다른 사람들에게 가장 먼저 소개해 주세요!
상담
자주 묻는 질문(FAQ)
트레이딩 봇, 지표, 플러그인 등 cTrader Store에서 제공되는 상품은 제3자 개발자에 의해 제공되며, 이는 단순히 정보 및 기술적 접근을 목적으로 제공된 것입니다. cTrader Store는 중개인이 아니며, 투자 조언, 개인별 추천 또는 향후 성과에 대한 어떠한 보장도 제공하지 않습니다.


가격
157
무료 설치