คำอธิบาย
เติมเต็มกลยุทธ์ของคุณด้วยสัญญาณตัวชี้วัดนี้👇🏻
https://ctrader.com/pt/products/1560?u=Goulart
✔คุณสมบัติตัวชี้วัด
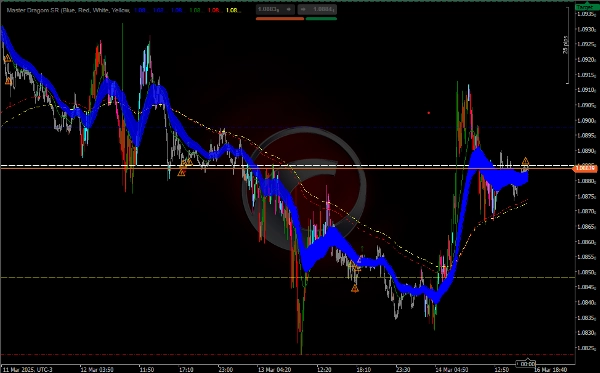
แนวรับและแนวต้าน (SR):
ตัวชี้วัดจะวาดเส้นแนวนอนสำหรับระดับแนวรับและแนวต้านรายวัน รายสัปดาห์ และรายเดือน
คุณสามารถเปิดหรือปิดใช้งานแต่ละระดับ (เปิด ปิด สูง และต่ำ) ตามความต้องการ
ค่าเฉลี่ยเคลื่อนที่แบบเอ็กซ์โพเนนเชียล (EMA):
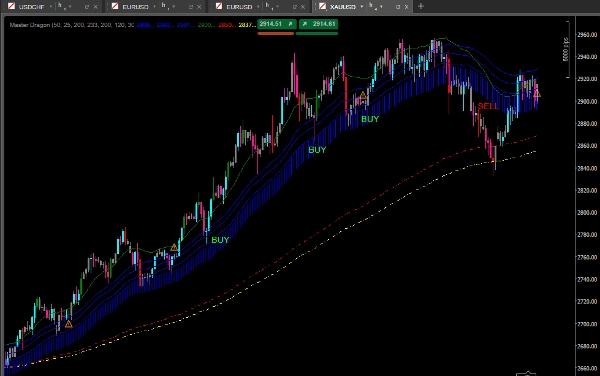
ตัวชี้วัดคำนวณ EMA หลายค่า (50, 25, 200 และ 233 ช่วงเวลา) เพื่อช่วยระบุแนวโน้มและพื้นที่แนวรับ/แนวต้านแบบไดนามิกที่เป็นไปได้
EMA จะถูกวางบนกราฟด้วยสีที่แตกต่างกันเพื่อให้ง่ายต่อการดู
การวิเคราะห์ปริมาณ (PVAVolumeAnalysis):
ตัวชี้วัดวิเคราะห์ปริมาณเพื่อระบุการกลับตัวหรือการดำเนินแนวโน้มที่เป็นไปได้
มันเน้นแท่งที่มีปริมาณสูงกว่าค่าเฉลี่ยและสัญญาณการเปลี่ยนแปลงปริมาณที่สำคัญด้วยไอคอน (↑, ↓, ⚠️)
การระบายสีแท่ง:
แท่งจะถูกระบายสีตามปริมาณและทิศทางราคา (ขึ้นหรือลง) ซึ่งช่วยระบุความแข็งแกร่งของแนวโน้ม
การวิเคราะห์แนวโน้มด้วย EMA:
ใช้ EMA เพื่อระบุทิศทางของแนวโน้ม:
ถ้าราคาสูงกว่า EMA (โดยเฉพาะ EMA 200 และ 233) แนวโน้มจะเป็นขาขึ้น
ถ้าราคาต่ำกว่า EMA แนวโน้มจะเป็นขาลง
พื้นที่ระหว่าง EMA 50 สูงและต่ำสามารถใช้เป็นโซนที่น่าสนใจสำหรับการกลับตัวหรือดำเนินต่อ
การวิเคราะห์ปริมาณ:
สังเกตไอคอนและสีแท่งเพื่อระบุการเปลี่ยนแปลงของปริมาณ:
ปริมาณสูงพร้อมราคาขึ้น (↑): ยืนยันแนวโน้มขาขึ้น
ปริมาณสูงพร้อมราคาลง (↓): ยืนยันแนวโน้มขาลง
ปริมาณต่ำพร้อมราคาขึ้นหรือลง (⚠️): อาจเกิดการกลับตัว
การรวมสัญญาณ:
รวมสัญญาณของปริมาณ EMA และระดับ SR เพื่อทำการตัดสินใจเข้าออก
ตัวอย่างเช่น หากราคาใกล้ระดับแนวต้านและปริมาณลดลง อาจเป็นสัญญาณกลับตัว
กลยุทธ์ที่แนะนำ
กลยุทธ์แนวโน้มพร้อมการยืนยันปริมาณ
ระบุแนวโน้ม:
ใช้ EMA (200 และ 233) เพื่อกำหนดแนวโน้มหลัก
ถ้าราคาสูงกว่า EMA ให้พิจารณาซื้อเท่านั้น
ถ้าราคาต่ำกว่า EMA ให้พิจารณาขายเท่านั้น
รอการดึงกลับ:
รอให้ราคากลับไปยัง EMA ช่วงเวลาสั้นกว่า (50 หรือ 25) หรือระดับ SR
ยืนยันด้วยปริมาณ:
ตรวจสอบว่าปริมาณเพิ่มขึ้นในทิศทางของแนวโน้มหรือไม่ (↑ สำหรับซื้อ, ↓ สำหรับขาย)
MA ระบุแนวโน้ม การดึงกลับ สัญญาณปริมาณ การกลับตัว แนวรับและแนวต้าน
ถ้าปริมาณลดลง (⚠️) หลีกเลี่ยงการเข้า หรือพิจารณาการกลับตัว
การเข้า:
ซื้อเมื่อราคาสูงกว่า EMA และใกล้ระดับแนวรับ โดยมีปริมาณยืนยันแนวโน้มขาขึ้น
ขายเมื่อราคาต่ำกว่า EMA และใกล้ระดับแนวต้าน โดยมีปริมาณยืนยันแนวโน้มขาลง
การออก:
ใช้ระดับ SR หรือ EMA เป็นเป้าหมายหรือจุดออก
ตัวอย่างเช่น ปิดหรือขายเมื่อถึงระดับแนวรับ
สรุป
Volume analysis is integrated to detect potential trend reversals or continuations by highlighting bars with above-average volume and signaling significant volume changes using icons (↑ for rising volume confirming uptrends, ↓ for falling volume confirming downtrends, and ⚠️ for low volume indicating possible reversals). Bars are color-coded based on volume and price direction to visually represent trend strength.
Traders can combine signals from volume, EMAs, and support/resistance levels to make informed entry and exit decisions. A suggested strategy involves identifying the main trend using the 200 and 233 EMAs, waiting for pullbacks to shorter EMAs or support/resistance levels, and confirming with volume signals before entering trades. Exit points can be set at support/resistance levels or EMA lines. This indicator is suitable for enhancing trend, pullback, volume, reversal, and support/resistance analysis in various trading strategies.
รีวิวจากลูกค้า
5 | 100 % | |
4 | 0 % | |
3 | 0 % | |
2 | 0 % | |
1 | 0 % |