
Deskripsi
🎯 INTELIJENSI VOLATILITAS MULTI-TIMEFRAME
Berhenti Melewatkan Breakout Volatilitas - Lihat Setiap Timeframe Secara Bersamaan
Sebagian besar indikator volatilitas hanya menunjukkan satu perspektif. Indikator Volatilitas Bergulir Multi-Timeframe memberikan gambaran lengkap di periode jangka pendek (7), jangka menengah (21), dan jangka panjang (63) - dengan sinyal trading bawaan yang memberi tahu Anda kapan harus bertindak.
⚡ MENGAPA MULTI-TIMEFRAME VOLATILITAS MENGUBAH SEGALANYA
Timeframe Tunggal vs Pendekatan Multi-Timeframe Kami:
- ❌ Periode Tunggal: Anda melihat pohon tapi melewatkan hutan
- ✅ Tiga Periode: Lanskap volatilitas lengkap dengan konteks
Skenario Trading Nyata:
- Lonjakan jangka pendek saat ketenangan jangka panjang → Kebisingan sementara (abaikan)
- Semua timeframe naik → Perubahan rezim nyata (bertindak)
- Ketenangan jangka pendek di tengah kekacauan jangka panjang → Ketenangan palsu (hati-hati)
🎯 FITUR PROFESIONAL
✨ VISIBILITAS TRIPLE TIMEFRAME
- StdDev 7: Tangkap pergeseran volatilitas segera (intraday)
- StdDev 21: Volatilitas jangka menengah (swing trading)
- StdDev 63: Konteks volatilitas jangka panjang (position trading)
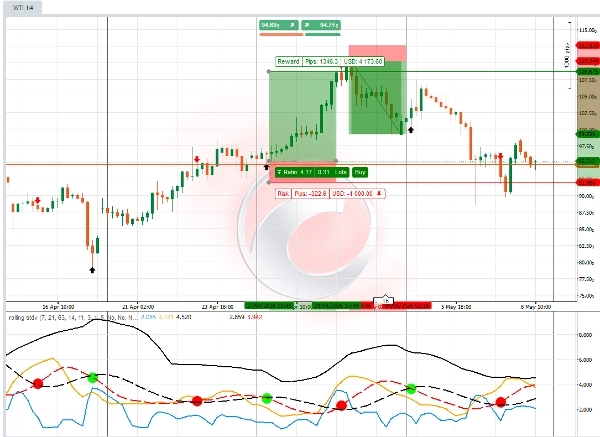
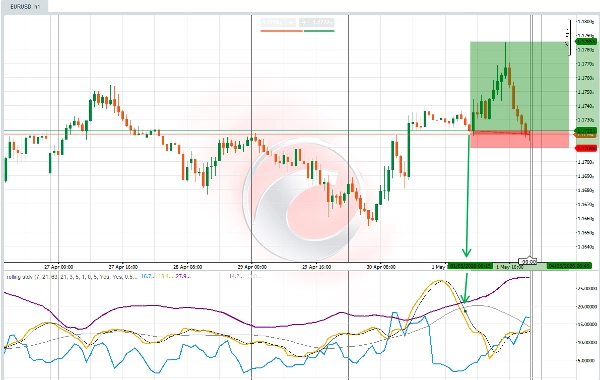
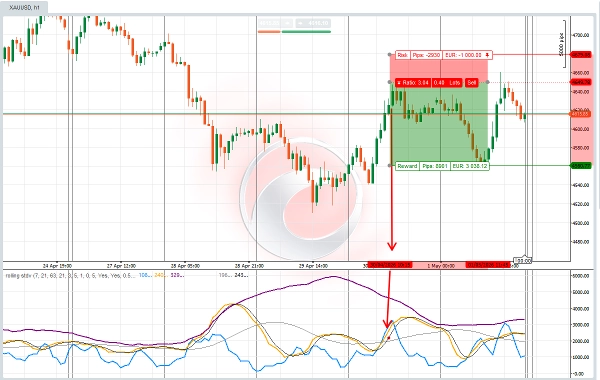
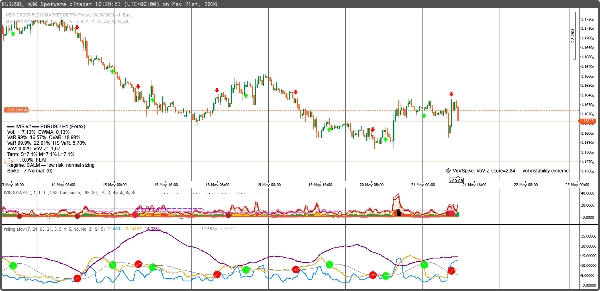
- Sinyal osilator: ketika rata-rata garis sinyal Rolling Standard Deviation saling bersilangan, yang titik berwarna mengonfirmasi volatilitas lebih tinggi dan lebih rendah serta arah aksi harga. Dengan sinyal Titik Merah dan Titik Hijau yang besar, Trader juga akan melihat sinyal Panah Merah dan Panah Hijau pada grafik, yang dapat membantu menentukan level masuk dan ukuran perdagangan.
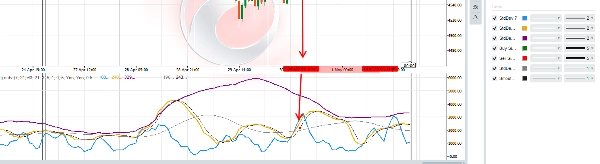
- Rolling Standard Deviation adalah osilator volatilitas dengan logika sinyal pasar prediktif. Parameter pada panel harus diperiksa dan disesuaikan dengan jenis instrumen CFD yang ingin diperdagangkan trader. Setiap instrumen CFD Aset Keuangan dapat memiliki pengaturan panel yang sedikit berbeda. Trader dapat memilih akurasi dan presisi pembacaan volatilitas, dengan mengaktifkan: Slope, sinyal persilangan Cepat/Tengah, dan Smoothing.
📊 ANALISIS VOLATILITAS LANJUTAN
- Persilangan Volatilitas: Garis StdDev bersilangan = perubahan rezim
- Sinyal Mean Reversion: Volatilitas kembali ke rata-rata
- Deteksi Lonjakan: Peristiwa volatilitas ekstrem
💡 SEMPURNA UNTUK GAYA TRADING INI:
🎯 Trader Breakout Volatilitas
- Masuk saat volatilitas rendah sebelum pergerakan eksplosif
- Keluar saat volatilitas tinggi sebelum pembalikan
- Waktu masuk dengan presisi menggunakan konfirmasi tiga kali
📈 Trader Mean Reversion
- Redam ekstrem volatilitas dengan percaya diri
- Identifikasi kondisi pasar yang terlalu jauh
- Gunakan volatilitas sebagai indikator kontrarian
🛡 Trader yang Menghindari Risiko
- Hindari periode volatilitas tinggi sepenuhnya
- Perdagangan hanya selama pasar yang tenang dan dapat diprediksi
- Gunakan volatilitas sebagai panduan ukuran posisi
📊 Trader Opsi
- Menjual premi waktu saat volatilitas tinggi
- Membeli opsi saat kompresi volatilitas
- Analisis IV vs HV untuk kesalahan harga
Sinyal Pintar Bawaan:
- ✅ Beli saat: Volatilitas turun di bawah ambang batas ATAU melintasi di bawah rata-rata bergerak
- ✅ Jual saat: Volatilitas melonjak di atas ambang batas ATAU melintasi di atas rata-rata bergerak
📈 APA YANG ANDA DAPATKAN:
✅ Visibilitas Triple Timeframe - Tidak perlu lagi menebak konteks volatilitas
✅ Sinyal Beli/Jual Otomatis - Panah visual jelas di titik optimal
✅ Deteksi Rezim Volatilitas - Ketahui kapan pasar tenang atau kacau
✅ Ambang Batas yang Dapat Disesuaikan - Sesuaikan dengan gaya trading atau aset apa pun
✅ Pengkodean Warna Profesional - Pemahaman visual instan
💰 HARGA PELUNCURAN SPESIAL: $50
(Harga reguler: $100)
Rincian Nilai:
- Indikator StdDev 7: nilai $29
- Indikator StdDev 21: nilai $29
- Indikator StdDev 63: nilai $29
- Sinyal Trading: nilai $49
- Total Nilai: $136
- Harga Anda: $50 (Hemat 35%)
Termasuk: Indikator penuh Warna
🎁 BONUS: Panduan Waktu Volatilitas Gratis
Pembelian termasuk "Penguasaan Volatilitas Multi-Timeframe" - nilai $39 GRATIS.
Termasuk:
- Strategi trading kompresi volatilitas
- Teknik konfirmasi multi-timeframe
- Manajemen risiko untuk periode volatil
- Contoh perdagangan dunia nyata
🚀 SIAP MENGUASAI WAKTU VOLATILITAS?
Klik "Tambah ke Keranjang" dan ubah cara Anda melihat dan memperdagangkan volatilitas pasar.
"Saya telah mencoba setiap indikator volatilitas yang ada. Pendekatan triple timeframe dengan sinyal bawaan inilah yang saya gunakan setiap hari dalam trading prop firm saya."
- Sarah Rodriguez, Trader Swing Profesional
SEMPURNA UNTUK PASAR INI:
📊 Saham & ETF
- Timing volatilitas SPY, QQQ
- Rotasi sektor berdasarkan volatilitas
- Perdagangan volatilitas pendapatan
💹 Pasangan Forex
- Analisis volatilitas pasangan utama
- Penilaian risiko carry trade
- Konfirmasi breakout
📈 Komoditas
- Siklus volatilitas emas
- Lonjakan volatilitas minyak
- Volatilitas musiman pertanian
🔄 Cryptocurrency
- Rezim volatilitas BTC/ETH
- Peluang volatilitas altcoin
- Manajemen risiko di crypto
Kesimpulan: Ini bukan hanya indikator deviasi standar biasa. Ini adalah sistem waktu volatilitas lengkap yang menunjukkan dengan tepat kapan pasar akan bergerak.
Penawaran Peluncuran Terbatas: 150 salinan pertama seharga $89 (hemat $30)
"Perbedaan antara trading amatir dan profesional sering kali terletak pada waktu volatilitas. Indikator ini menutup kesenjangan itu."
Tambah ke Keranjang Sekarang → Mulai Trading Volatilitas Seperti Profesional.
Ringkasan
Key features include:
- Triple timeframe visibility for immediate, swing, and position trading contexts.
- Volatility crossovers signaling regime shifts.
- Mean reversion and spike detection for volatility extremes.
- Customizable parameters to adapt to different CFD instruments and trading styles.
- Professional color-coded signals for quick interpretation.
This indicator suits various trading styles, including volatility breakout, mean reversion, risk-averse, and options trading. It supports multiple markets such as stocks, ETFs, forex pairs, commodities, and cryptocurrencies, providing volatility timing insights for assets like SPY, QQQ, gold, oil, BTC, and ETH.
Included with the indicator is a volatility timing guide covering compression strategies, multi-timeframe confirmation, risk management, and real trade examples. The tool requires tick data and outputs actionable signals to enhance volatility-based trading decisions.
Ulasan pelanggan
5 | 50 % | |
4 | 50 % | |
3 | 0 % | |
2 | 0 % | |
1 | 0 % |


