Deskripsi
Indikator Toko Pinescriptlabs: cBot Toko Pinescriptlabs : (cBot) Gold & BTC BreakoutSession Pivots(baru)
PRICE ACTION (Baru)
Trailing Smart Algorithm (baru)
Prediksi Berdasarkan Linreg & ATR
SmartTrend Dukungan &
Resistensi
Garis
Analisis
Struktur Pasar
Dinamis
dari
Titik
Pembalikan
Fibonacci
Regresi
Linear
Multi-timeframe
Pelacak
Bias Lilin
Multi-Level
Dukungan
dan Resistensi
Otomatis
Garis Tren
Garis
Semua
Dukungan dan
Resistensi
Level
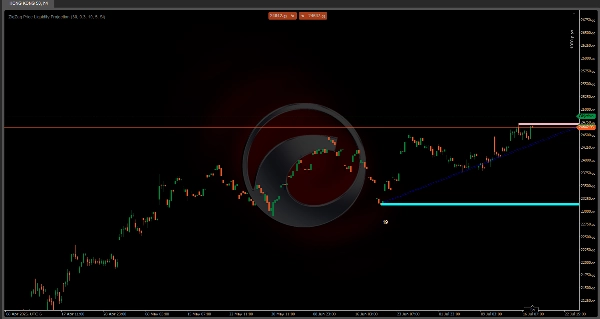
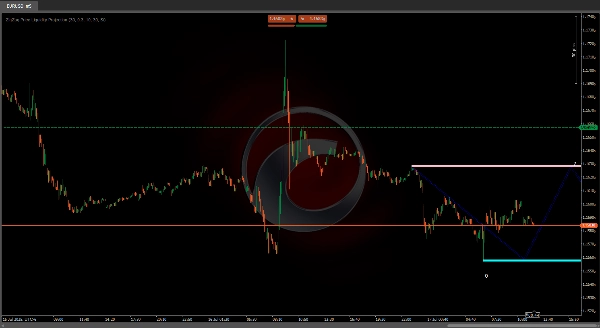
📊 Indikator Proyeksi Likuiditas Harga ZigZag
"Lihat di mana pasar mungkin berbalik sebelum itu terjadi!" 🔮
Indikator ini mengidentifikasi level dukungan/resistensi utama 🛑 dan memprediksi zona likuiditas 💧 pada grafik Anda menggunakan:
- 🔍 Titik Pivot: Mendeteksi titik tertinggi dan terendah yang signifikan
- 📈 Volatilitas ATR: Mengukur fluktuasi harga untuk penyetelan presisi
- 💦 Proyeksi Likuiditas: Memperkirakan area aktivitas tinggi (klaster beli/jual) melalui pola zigzag
🎯 Tujuan: Memprediksi zona reaksi harga (pantulan/terobosan/konsolidasi) untuk meningkatkan keputusan masuk/keluar
✨ Keunggulan Zigzag
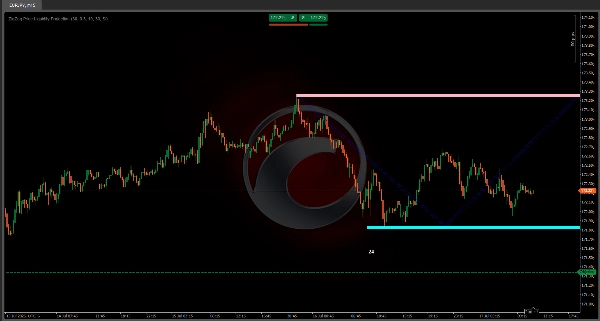
Garis-garis yang terhubung ini berfungsi seperti peta harta karun 🗺️ yang menunjukkan:
1️⃣ Jalur harga masa depan dalam rentang yang ditentukan
2️⃣ Zona pembalikan potensial di mana harga mungkin berhenti atau berbalik
3️⃣ Titik referensi visual untuk perencanaan perdagangan
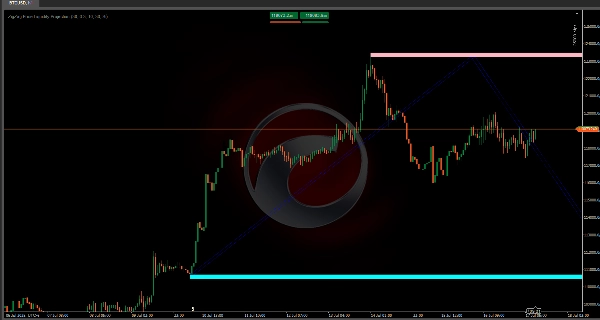
🚦 Fitur Utama:
- 📅 Sistem peringatan dini untuk level penting
- 🎯 Memproyeksikan pergerakan masa depan berdasarkan struktur pivot (jalur bullish/bearish)
- 🔢 Penghitung sentuhan (misalnya, "24" = 24 pengujian historis pada level tersebut)
⚙️ Pengaturan yang Direkomendasikan
PengaturanNilaiEfek
Periode ATR
30
🎚️ Sensitivitas volatilitas
Periode Pivot
30
🔍 Rentang signifikansi pivot
⏳ Timeframe Terbaik: grafik 15menit - 4jam ⏱️
💡 Tips Profesional:
"Gabungkan dengan pola candlestick 🕯️ untuk konfirmasi! Zigzag menunjukkan KE MANA harga mungkin pergi, lilin menunjukkan KAPAN itu terjadi."
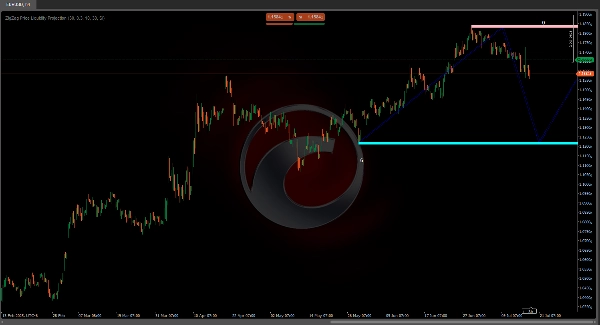
🎯 Kesimpulan Akhir:
Alat visual serba guna yang kuat untuk mengenali:
✅ Zona likuiditas 💦
✅ Level kritis 🎯
✅ Jalur harga masa depan 🚀
Sempurna untuk trader intraday yang ingin mengantisipasi pergerakan daripada mengejarnya! 🏃💨