
Bar Explosion
Индикатор
204 скачивания
Версия 1.0, May 2025
Windows, Mac
Описание
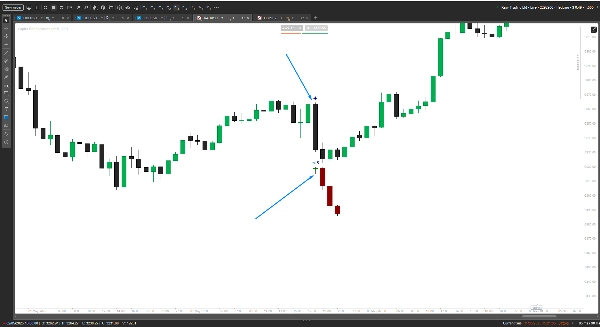
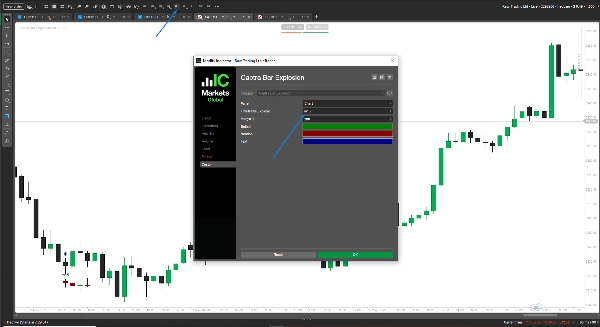
Раскройте мощь Captra's Bars Explosion — первоклассного индикатора для cTrader, созданного, чтобы доминировать в вашей торговле. Этот зверь накладывает взрывные визуализации свечей на мини-таймфреймах, позволяя вам с точностью бритвы выявлять тренды. Настраивайте таймфрейм (например, Minute15), цвета (бычий/зеленый, медвежий/темно-красный) и маржи (по умолчанию 30 пунктов) под свой стиль. Идеально подходит для скальперов и свинг-трейдеров, создан для cTrader с плавной производительностью.
Пожалуйста, оставьте отзыв, чтобы сообщить нам, полезен ли он.
Сводка
ИИ-сводка
Bar Explosion is a cTrader indicator that overlays mini-timeframe candlestick visuals onto your main chart, enabling precise trend identification. Users can customize the indicator’s timeframe (e.g., 15 minutes), colors for bullish (green) and bearish (dark red) bars, and margin settings (default 30 pips) to suit different trading styles. Designed for scalpers and swing traders, it provides detailed, smaller timeframe bar information directly on higher timeframe charts, enhancing market analysis without switching views. The indicator is optimized for smooth performance within the cTrader platform.
Профиль индикатора
Отзывы покупателей
0.0
Отзывы: 0
Отзывы покупателей
У этого продукта еще нет отзывов. Уже попробовали его? Поделитесь впечатлениями!
Обсуждение
Частые вопросы
Продукты, доступные в cTrader Store, включая торговых ботов, индикаторы и плагины, предоставляются сторонними разработчиками и доступны исключительно в информационных и технических целях. cTrader Store не является брокером и не предоставляет инвестиционные консультации, персональные рекомендации или какие-либо гарантии будущей доходности.
Больше от этого автора


![Логотип продукта "[Stellar Strategies] Inside Bar with Signals"](https://cdn.ctrader.com/image/webp/1d9e8bfa-3b2c-4440-bb37-5856902008a7_30683)


Цена
86.22M
Торгуемый объем
1.92M
Выигранные пипы
3.58K
Бесплатные установки