
Head Shoulders Finder
指标
445 下载
版本 1.0, May 2025
Windows 版、Mac 版
5.0
评价:1
说明
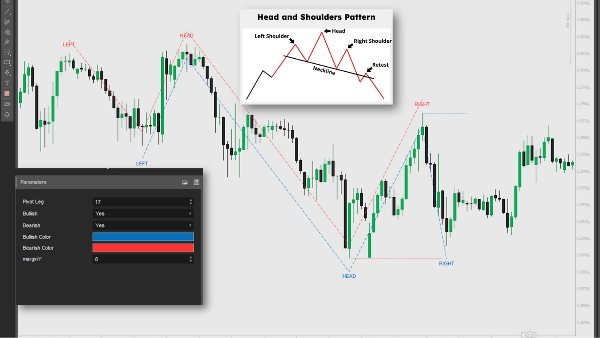
该指标通过分析价格数据中的枢轴高点和低点来识别头肩顶和倒头肩形态。它绘制线条、标签和潜在趋势反转的信号,当价格跌破颈线时触发做空条件(看跌),当价格高于颈线时触发做多条件(看涨)。交易者可以利用这些信号进入做空或做多仓位,结合其他分析和风险管理以优化交易策略。
摘要
AI 摘要
The Head Shoulders Finder is a technical indicator designed to detect Head and Shoulders and Inverted Head and Shoulders chart patterns by analyzing pivot highs and lows in price data. It visually marks these patterns with lines and labels on the price chart, highlighting potential trend reversal points. The indicator generates trading signals by identifying when the price crosses the neckline: a break below signals a bearish trend reversal suitable for short positions, while a break above indicates a bullish reversal for long positions. Traders can use these signals alongside other technical analyses and risk management strategies to inform entry decisions. This tool supports pattern recognition and signal plotting to assist in identifying potential trading opportunities based on classic reversal formations.
指标配置
客户评价
5.0
评价:1
5 | 100 % | |
4 | 0 % | |
3 | 0 % | |
2 | 0 % | |
1 | 0 % |
客户评价
August 18, 2025
Automatically detects Head & Shoulders patterns, customizable visuals. Cons: No pattern reliability filter, no alerts, false signals on low TFs.
讨论
常见问答
cTrader Store 提供的所有产品,包括交易机器人、指标和插件,均由第三方开发者提供,仅供信息参考和技术访问之用。cTrader Store 并非经纪商,不提供投资建议、个人推荐或任何未来业绩保证。
该作者的其他作品


猜您喜欢


价格
86.49M
交易量
1.97M
盈利点数
3.65K
免费安装