
说明
3根K线反转
📊 它是什么?
3根K线反转是一种技术指标,用于识别由恰好三根连续蜡烛线形成的特定反转形态。这个经典形态通过清晰的视觉结构——趋势蜡烛线、疲劳蜡烛线和反转蜡烛线——提示价格方向的潜在变化。
🎯 它的用途是什么?
该指标帮助交易者:
- 识别多头和空头反转,基于3根蜡烛线结构
- 过滤假信号,通过可配置的趋势确认
- 识别支撑和阻力区域,基于已确认的形态
- 直观展示交易机会,通过图表标记
- 在任何时间框架内交易高概率反转
🔍 它如何工作?
多头形态(3根K线多头反转)
三根蜡烛线结构:
- 蜡烛线1(空头):收盘价低于开盘价 - 确认卖压
- 蜡烛线2(空头疲劳):创出新低且新高低于蜡烛线1,且收盘价为空头 - 投降信号 ⚠️
- 蜡烛线3(多头反转):收盘价高于开盘价且高点高于蜡烛线1的高点 - 确认控制权转移 ✅
空头形态(3根K线空头反转)
相反结构:
- 蜡烛线1(多头):收盘价高于开盘价 - 确认买压
- 蜡烛线2(多头延伸):创出新高且新低高于蜡烛线1,且收盘价为多头 - 过度延伸信号 ⚠️
- 蜡烛线3(空头反转):收盘价低于开盘价且低点低于蜡烛线1的低点 - 确认控制权转移 ✅
可视化管理系统(状态机)
该指标按顺序处理每个形态的三个阶段:
阶段1 - 形态检测: 🔍
- 识别完整的3根蜡烛线结构
- 第三根蜡烛线上出现一个三角形指标(▲多头 / ▼空头)
- 绘制一个半透明设置矩形覆盖:
-
- 多头:从蜡烛线1的高点到最低低点(蜡烛线2或3)
- 空头:从蜡烛线1的低点到最高高点(蜡烛线2或3)
- 该矩形标记了发生反转的“战斗区”
阶段2 - 确认或无效: ⏳
系统等待形态后的下一根蜡烛线以验证形态:
多头确认: ✅
- 下一根蜡烛线的收盘价必须超过蜡烛线1的高点(矩形顶部)
- 出现一个实心点(●)标记确认
- 矩形变为有效支撑区
空头确认: ✅
- 下一根蜡烛线的收盘价必须跌破蜡烛线1的低点(矩形底部)
- 出现一个实心点(●)标记确认
- 矩形变为有效阻力区
无效: ❌
- 多头失败如果:收盘价低于矩形最低点或出现空头形态
- 空头失败如果:收盘价高于矩形最高点或出现多头形态
- 矩形停止延伸(形态失效)
等待延伸: ⏸️
- 如果没有确认或失败,矩形将逐根蜡烛线水平延伸
阶段3 - 有效支撑/阻力区: 🎯
- 一旦确认,该区域向右无限延伸
- 多头区域:只要价格保持在底部之上,该区域保持有效
- 空头区域:只要价格保持在顶部之下,该区域保持有效
- 当价格完全突破该区域反方向时,区域失效
⚙️ 主要配置
形态模式
控制接受哪些形态变体:
- 普通:仅接受蜡烛线3收盘价在蜡烛线1区间内的情况
-
- 多头:收盘价 < 蜡烛线1的高点(中度反转)
- 空头:收盘价 > 蜡烛线1的低点(中度反转)
- 增强:仅接受蜡烛线3收盘价在蜡烛线1区间外 🔥
-
- 多头:收盘价 > 蜡烛线1的高点(爆发性反转)
- 空头:收盘价 < 蜡烛线1的低点(爆发性反转)
- 全部(推荐):接受两种类型,无区别 ⭐
支撑/阻力类型
- 水平线:基础线功能(本版本有限)
- 区域:确认后绘制阴影矩形标记支撑阻力区域 📦
- 无:无支撑阻力区域,仅显示检测到的形态
可自定义颜色 🎨
- 多头反转颜色:用于三角形、矩形和多头区域(默认:
#2962FF- 蓝色) - 空头反转颜色:用于三角形、矩形和空头区域(默认:
#FF9800- 橙色) - 多头趋势颜色:用于趋势过滤可视化(默认:
#089981- 绿色) - 空头趋势颜色:用于趋势过滤可视化(默认:
#F23645- 红色)
🔧 趋势过滤器
该指标可以使用四种方法根据整体趋势方向过滤形态:
1. 移动平均云 ☁️
使用两条移动平均线识别趋势:
参数:
- 移动平均类型:简单、指数、Hull、加权等(默认:Hull)
- 快速周期:50(默认)
- 慢速周期:200(默认)
过滤逻辑(对齐):
- 检测到多头趋势当:价格 > 快速MA且快速MA > 慢速MA ✅
- 检测到空头趋势当:价格 < 快速MA且快速MA < 慢速MA ✅
- 仅在多头趋势显示多头形态,在空头趋势显示空头形态
相反逻辑(相反):
- 反转条件以捕捉主要的逆势反转
2. 超级趋势 📈
基于波动率的趋势跟踪指标(ATR):
参数:
- ATR周期:10(默认)- 波动率计算窗口
- 乘数因子:3.0(默认)- 指标灵敏度
逻辑:
- 使用ATR计算上下轨道
- 价格高于超级趋势 = 多头趋势 🟢
- 价格低于超级趋势 = 空头趋势 🔴
- 根据配置的对齐方式过滤形态
3. 唐奇安通道 📊
使用一段时间内的价格极值:
参数:
- 通道长度:13(默认)
逻辑:
- 上轨 = N周期内最高高点
- 下轨 = N周期内最低低点
- 中点 = (上轨 + 下轨)/ 2
- 价格高于中点 = 多头趋势 🟢
- 价格低于中点 = 空头趋势 🔴
4. 无(无过滤) 🔓
显示所有检测到的3根K线形态,不考虑整体趋势。适用于:
- 区间震荡市场
- 纯形态分析
- 任何环境下的反转交易
趋势对齐
当过滤器激活时应用:
- 对齐:仅显示与识别趋势一致的形态 ➡️
-
- 多头趋势中仅显示多头形态
- 空头趋势中仅显示空头形态
- 相反:仅显示与识别趋势相反的形态 🔄
-
- 空头趋势中的多头形态(重大反转)
- 多头趋势中的空头形态(重大反转)
摘要
AI 摘要
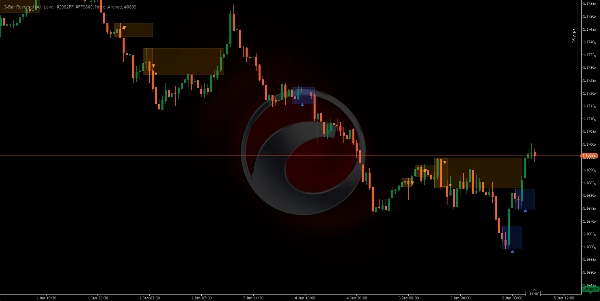
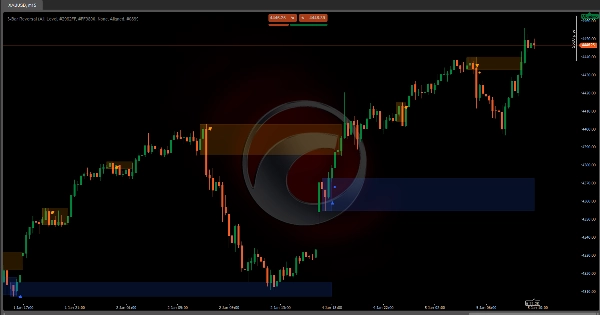
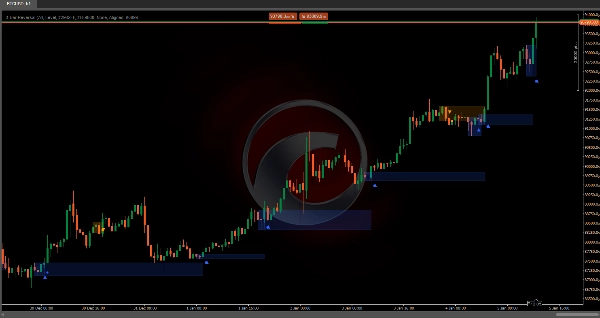
The 3-Bar Reversal indicator identifies specific bullish and bearish reversal patterns formed by exactly three consecutive candles. It detects a classic three-candle structure consisting of a trend candle, an exhaustion candle, and a reversal candle, signaling potential price direction changes. The indicator visually marks these patterns on charts with triangles and semi-transparent rectangles highlighting the "battle zone" where reversals occur.
It operates in three phases: pattern detection, confirmation or invalidation based on the next candle's behavior, and establishing active support or resistance zones that extend while price respects them. The indicator supports configurable pattern modes (Normal, Enhanced, or All) to control acceptance criteria for reversals.
Trend filtering is available through four methods—Moving Average Cloud, Supertrend, Donchian Channels, or no filter—allowing users to align pattern signals with overall market trends or capture counter-trend reversals. Confirmed reversal zones are displayed as shaded rectangles or levels, customizable in color for bullish and bearish signals, trend filters, and zones.
This tool is designed for use on any timeframe and across various markets, including forex pairs (EURUSD, GBPUSD, USDJPY, NZDUSD), commodities (XAUUSD), indices (NAS100), and cryptocurrencies (BTCUSD). It aids traders in detecting high-probability reversals, filtering false signals, and identifying support and resistance zones with clear visual markers.
指标配置
客户评价
0.0
评价:0
客户评价
该产品尚无评价。已经试过了?抢先告诉其他人!
讨论
常见问答
BTCUSD
Signal
EURUSD
Supertrend
GBPUSD
NZDUSD
XAUUSD
NAS100
ATR
USDJPY
cTrader Store 提供的所有产品,包括交易机器人、指标和插件,均由第三方开发者提供,仅供信息参考和技术访问之用。cTrader Store 并非经纪商,不提供投资建议、个人推荐或任何未来业绩保证。


价格
注册日期 03/10/2024
163
销售
39.09K
免费安装