
Описание
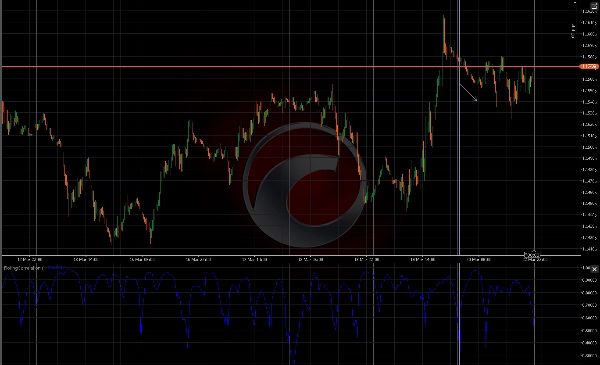
RollingCorrelation вычисляет скользящую корреляцию Пирсона между каждой ценой закрытия и её однобарным лагом в настраиваемом окне. Индикатор возвращает значения в диапазоне [-1, 1], где значения около +1 указывают на сильную положительную автокорреляцию (продолжение тренда), значения около -1 указывают на сильную отрицательную автокорреляцию (осцилляционное или разворотное поведение), а значения около 0 указывают на слабую или отсутствующую линейную автокорреляцию.
Как это работает Для каждого бара вычисляется коэффициент корреляции Пирсона между серией цен закрытия и той же серией, сдвинутой на один бар, в пределах указанного окна Period (по умолчанию 20). Реализация использует стандартную формулу ковариации / дисперсии для получения одного значения корреляции на бар.
Входные данные
- Period (int, по умолчанию 20): количество баров в скользящем окне. Для вычисления первого значения индикатору требуется как минимум Period+1 бар.
Выходные данные
- Correlation (линия): значение скользящей корреляции для каждого бара, диапазон [-1, 1].
Интерпретация и практическое применение
- Близко к +1: цена показывает сильную устойчивость — недавние движения, вероятно, продолжатся (полезно для сигналов следования за трендом).
- Близко к -1: сильная отрицательная автокорреляция — цена часто разворачивается от одного бара к другому (полезно для тактик возврата к среднему).
- Близко к 0: отсутствует последовательная линейная связь с лагом 1 — движение цены кажется случайным в пределах окна.
- Типичные сигнальные паттерны: пересечения порогов (например, >0.6 или <−0.6), устойчивые повышения/падения корреляции, дивергенция между ценой и корреляцией, или фильтрация входов из других систем (требуется корреляция > 0.5 для входов по тренду, или < −0.5 для разворотных установок).
Торговые идеи
- Комбинируйте с фильтрами волатильности (ATR), чтобы избегать сигналов во время низковолатильного шума.
- Используйте вместе с индикаторами тренда (скользящие средние, MACD) для подтверждения направления при положительной корреляции.
- Используйте как триггер краткосрочного возврата к среднему, когда корреляция сильно отрицательная, а цена находится на уровне поддержки/сопротивления или на экстремуме полос Боллинджера.
- Краткие таймфреймы (например, M1–M15) и короткие периоды подходят для скальпинга; более длинные периоды/таймфреймы — для подтверждения свингов.
Рекомендуемые настройки
- Период по умолчанию = 20 хорошо подходит в качестве отправной точки.
- Краткосрочный: Period 8–14 (скальпинг / внутридневной).
- Среднесрочный: Period 20–50 (свинг / подтверждение тренда).
- Избегайте слишком больших значений Period для очень шумных инструментов или слишком маленьких для очень медленно движущихся инструментов.
Ограничения и примечания
- Требуется как минимум Period+1 бар для вычисления значений.
- Если дисперсия цены внутри окна равна нулю (плоские цены), знаменатель корреляции может быть нулём — это может привести к NaN/неопределённым результатам. Используйте разумные значения Period и убедитесь, что инструмент имеет достаточное движение цены.
- Этот индикатор измеряет только линейную корреляцию с лагом 1; он не обнаруживает нелинейные связи или лаги с несколькими барами.
- Не является самостоятельной торговой системой — лучше использовать как фильтр или инструмент подтверждения в стратегии.
Рекомендуемые примеры для включения в галерею
- EURUSD H1 с Period=20, показывающий сильную корреляцию во время трендовой фазы.
- BTCUSD 1H, показывающий осцилляционное поведение и периоды отрицательной корреляции.
- XAUUSD 15m, демонстрирующий использование для скальпинга с коротким Period.
Сводка
For each bar, the indicator computes the Pearson correlation coefficient between the series of close prices and the same series shifted by one bar within the specified period. This calculation uses standard covariance and variance formulas to generate a single correlation value per bar.
Traders can use this indicator to identify trend strength or potential reversals, applying threshold crossings or sustained changes in correlation as signals. It is useful for trend-following strategies when correlation is positive and for mean-reversion tactics when correlation is negative. The indicator can be combined with volatility filters and other trend indicators for confirmation. It supports various markets including Forex, stocks, indices, commodities, and cryptocurrencies, and is applicable across multiple timeframes from scalping (M1–M15) to swing trading.
The indicator requires at least Period+1 bars to compute values and is intended as a supplementary tool rather than a standalone trading system.


![Логотип продукта "[Stellar Strategies] Smart ADX"](https://cdn.ctrader.com/image/webp/af13b084-b6f6-41db-b7bc-c7e688b57b05_36929)

![Логотип продукта "[Hamster-Coder] Pivot Points MTF"](https://cdn.ctrader.com/image/webp/4c143e5a-309c-40e3-a578-f04d1e133ffa_31159)


![Логотип продукта "[Stellar Strategies] Wave Trend Pro"](https://cdn.ctrader.com/image/webp/5f226fbb-245a-41cd-9cdd-b018257d5e6d_28617)


