
Time Marker
Indicateur
396 téléchargements
Version 1.0, May 2025
Windows, Mac
Description
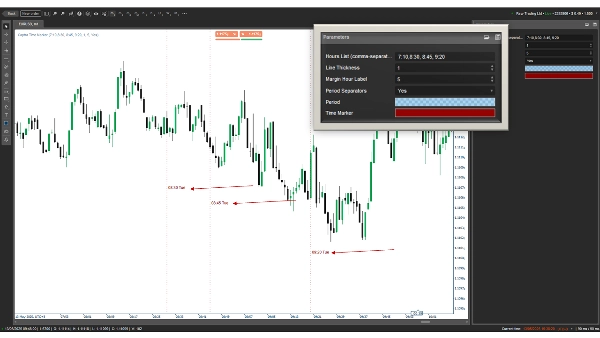
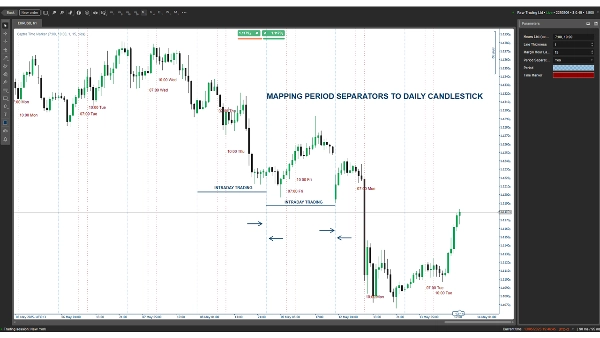
Captra Time Marker améliore votre expérience cTrader en marquant visuellement les heures définies par l'utilisateur (par exemple, 7:10, 8:30) avec des lignes verticales en pointillés et un texte étiqueté (par exemple, "07:10 Lun"). Idéal pour les traders se concentrant sur des heures de marché spécifiques, il prend en charge des entrées de temps personnalisables, l'épaisseur des lignes et le positionnement des étiquettes. Des séparateurs de période journalière optionnels mettent en évidence le début des sessions, avec des couleurs et styles configurables. Parfait pour les scalpers, les day traders et ceux qui ont besoin d'une analyse précise basée sur le temps. Facile à configurer, léger et compatible avec tous les intervalles de temps.
Résumé
Résumé IA
Time Marker is an indicator for cTrader that visually marks user-defined times on trading charts with dashed vertical lines and labeled text (e.g., "07:10 Mon"). It allows traders to specify exact times of interest, customize line thickness, and adjust label positioning. The indicator also offers optional daily period separators to highlight session starts, with configurable colors and styles. Designed for scalpers, day traders, and those requiring precise time-based analysis, it is lightweight, easy to set up, and compatible with all timeframes.
Profil de l'indicateur
Avis clients
0.0
Avis : 0
Avis clients
Il n'y a pas encore d'avis sur ce produit. Vous l'avez déjà essayé ? Soyez le premier à en parler aux autres !
Discussion
Questions fréquentes
Les produits disponibles sur cTrader Store, notamment les bots de trading, les indicateurs et les plug-ins, sont fournis par des développeurs tiers et mis à disposition à titre informatif et à des fins d'accès technique uniquement. cTrader Store n'est pas un courtier et ne fournit aucun conseil en investissement, aucune recommandation personnelle ni aucune garantie quant aux performances futures.
Plus de cet auteur


Prix
86.26M
Volume tradé
1.93M
Pips gagnés
3.59K
Installations gratuites