Penerangan
HTF Bias Detector — Edisi Panel
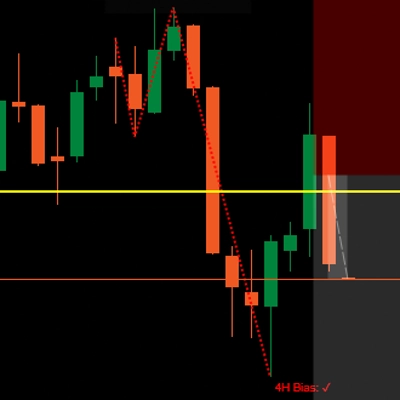
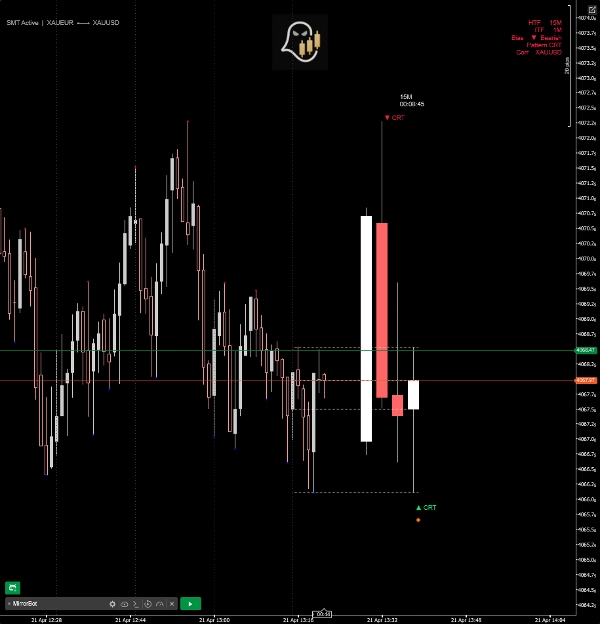
Lihat cerita jangka masa tinggi dengan sekilas. HTF Bias Detector memaparkan lilin jangka masa tinggi N terakhir dalam panel terapung terus pada carta anda — tiada keperluan untuk menukar jangka masa — dan secara automatik mengenal pasti bias dominan menggunakan empat corak tindakan harga institusi.
Bagaimana Ia Berfungsi
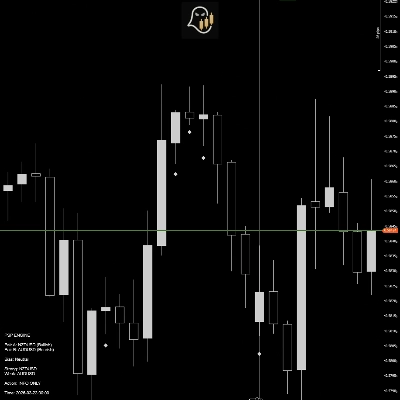
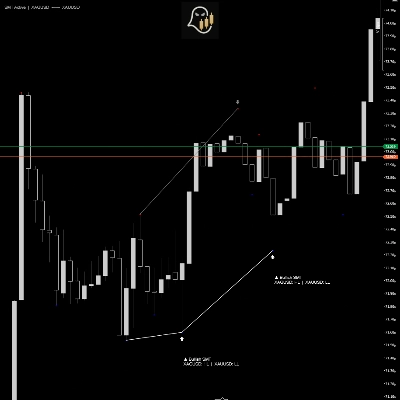
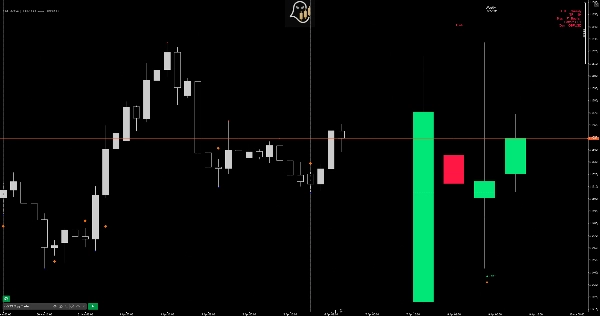
Penunjuk memetakan jangka masa carta semasa anda ke jangka masa tinggi semulajadinya (contoh: 5M → 1H, 1H → Harian) dan melukis lilin HTF tersebut dalam panel bersih yang dipasang di sebelah kanan harga. Pengesanan corak kemudian dijalankan pada lilin tersebut secara masa nyata.
Corak Dikesan
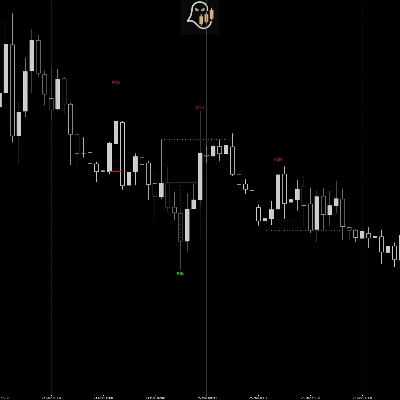
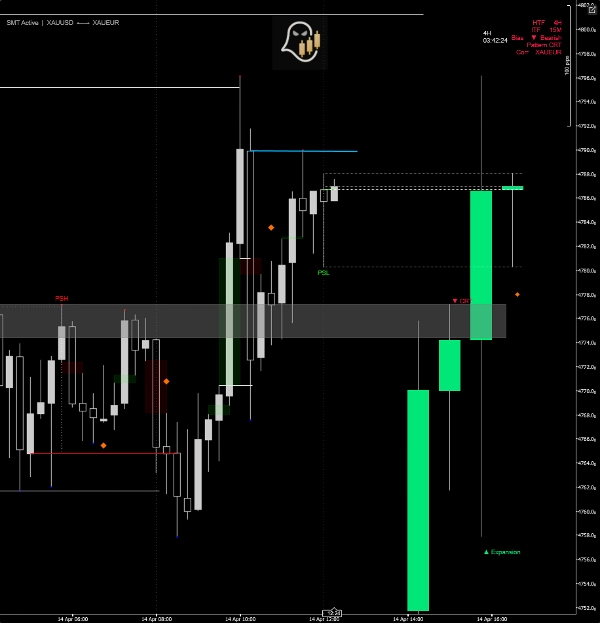
- CRT (Teori Julat Lilin) — mengenal pasti lilin perangkap yang menyapu tinggi atau rendah sebelumnya dan ditutup kembali di dalamnya, menandakan kemungkinan pembalikan.
- Pengembangan — menandakan lilin yang meliputi julat sebelumnya sepenuhnya dan ditutup melebihi julat itu, mengesahkan momentum arah.
- Titik Ayunan — mengesan urutan tiga lilin di mana lilin pergeseran diikuti oleh pembalikan kuat, menandakan titik perubahan struktur.
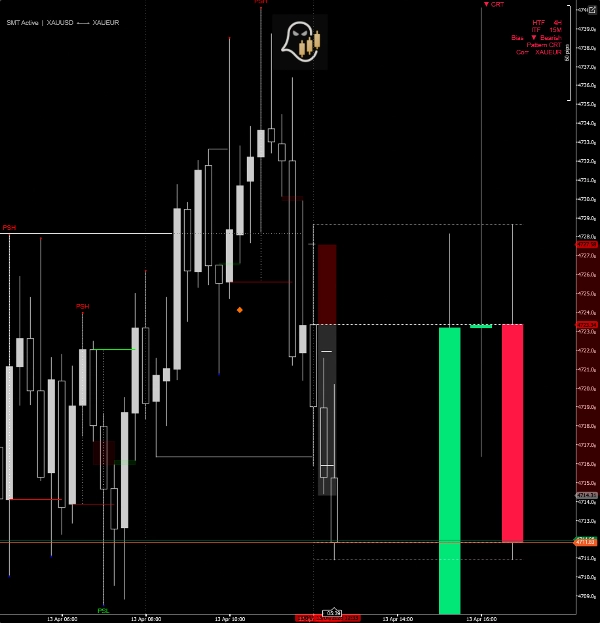
- PSP (Titik Ayunan Ketepatan) — isyarat divergensi silang pasangan. Apabila simbol utama dan pasangannya yang berkorelasi mencetak lilin arah bertentangan pada bar HTF yang sama, berlian PSP dilukis.
Divergensi SMT (Panel HTF)
Membandingkan pasangan lilin HTF berturut-turut antara instrumen berkorelasi. Apabila satu pasangan membuat rendah lebih rendah sementara yang lain membuat rendah lebih tinggi (atau sebaliknya pada tinggi), garis divergensi SMT dilukis terus pada panel dengan label arah.
Pengesanan Automatik Pasangan Berkorelasi
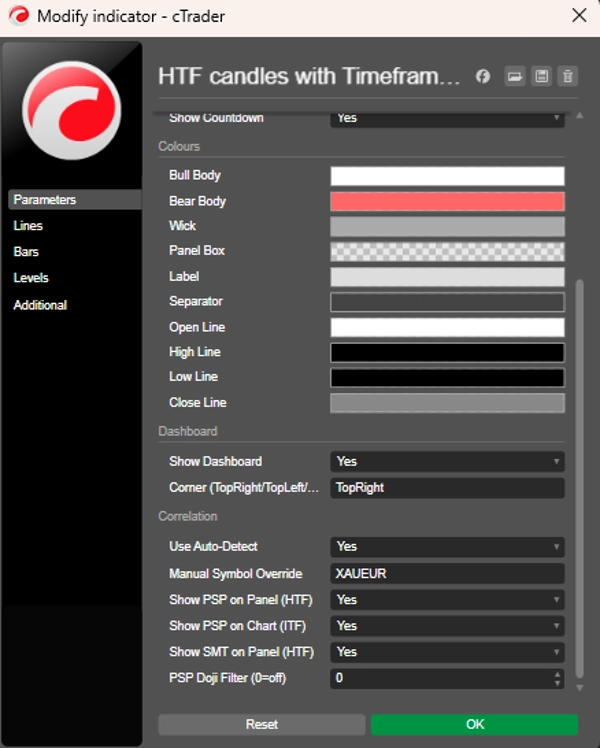
Secara automatik menyelesaikan instrumen berkorelasi untuk simbol carta anda — merangkumi pasangan forex utama, logam, indeks, dan kripto. Override manual juga tersedia untuk pasangan khusus atau nama simbol broker tertentu.
Ciri-ciri Tambahan
- Pemasa undur langsung ke penutupan lilin HTF seterusnya
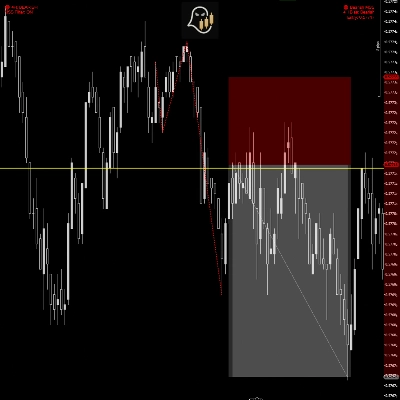
- Garis rujukan titik putus OHLC untuk lilin HTF yang sedang terbentuk
- Pemisah menegak pada carta langsung selari dengan masa buka HTF
- Papan pemuka padat menunjukkan HTF, ITF, bias dikesan, nama corak, dan pasangan berkorelasi
- Berlian PSP ITF dilukis terus pada bar carta (jangka masa semasa)
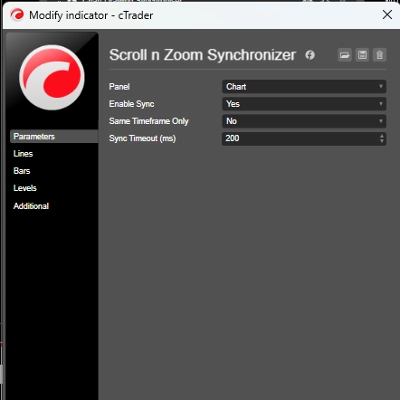
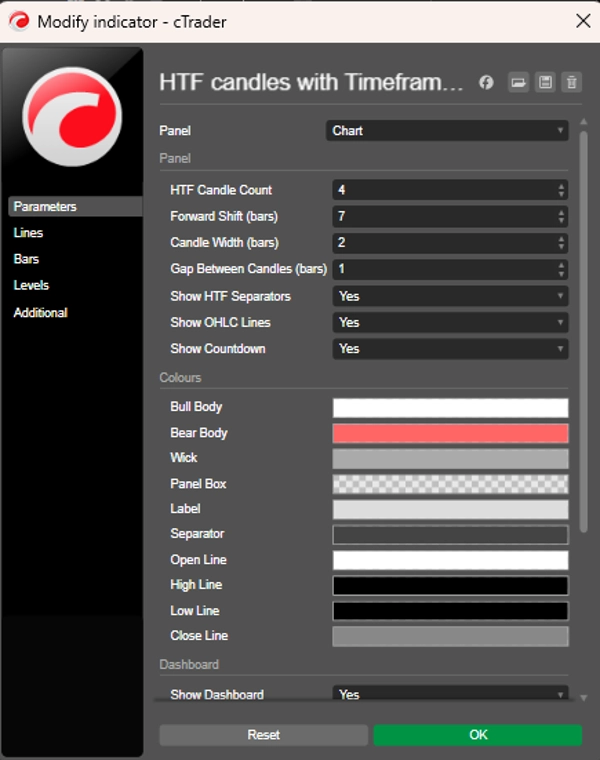
- Warna, lebar panel, bilangan lilin, dan penempatan yang boleh disesuaikan sepenuhnya
- Penapis Doji untuk menekan isyarat PSP yang lemah
Peta Jangka Masa
Carta TF Panel HTF
1M – 4M 15M
5M – 10M 1H
15M – 30M 4H
1H Harian
4H Mingguan
Harian Bulanan
Ringkasan
The indicator detects four institutional price action patterns in real time on these HTF candles: Candle Range Theory (CRT) trap candles signaling reversals, Expansion candles confirming momentum, Swing Point sequences marking structural turns, and Precision Swing Point (PSP) diamonds indicating cross-pair divergences. It also identifies SMT (Smart Money Technique) divergences between correlated instruments by comparing consecutive HTF candle pairs.
Correlated pairs are auto-detected for major forex pairs, metals, indices, and cryptocurrencies, with manual override options available. Additional features include a live countdown timer to the next HTF candle close, OHLC reference lines, vertical HTF open time separators, a compact dashboard showing HTF and intermediate timeframe bias and patterns, and customizable visual settings. The indicator supports multiple markets including forex, indices, and commodities.
Ulasan pelanggan
5 | 50 % | |
4 | 50 % | |
3 | 0 % | |
2 | 0 % | |
1 | 0 % |