
Penerangan
Indeks Tekanan Kecairan adalah alat gred profesional yang direka untuk memberikan pedagang pandangan yang lebih mendalam ke dalam dinamik tersembunyi kecairan pasaran. Berbeza dengan osilator tradisional yang hanya bertindak balas kepada harga, Indeks Tekanan Kecairan menggabungkan jumlah tick, pemampatan volatiliti, dan aliran arah ke dalam satu garis yang mudah dibaca. Ini menjadikannya rakan yang kuat untuk pedagang yang ingin memahami sama ada tekanan beli atau jual benar-benar menguasai di sebalik lilin.
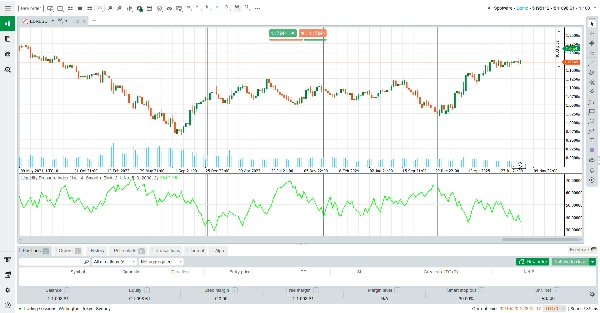
Pada intinya, ALB mengira keseimbangan antara kecairan beli terkumpul dan kecairan jual terkumpul, menormalkan hasil terhadap jumlah tick bergulung. Outputnya berpusat di sekitar tahap neutral 50. Nilai di atas 50 menunjukkan kecairan beli yang lebih kuat, manakala nilai di bawah 50 menonjolkan kecairan jual yang lebih kuat.
Petunjuk visual mudah ini membolehkan pedagang segera menilai aliran pesanan asas tanpa perlu mentafsir pelbagai penunjuk sekaligus.
Cara Membaca Penunjuk
Garis di atas 50: Pasaran menunjukkan kecairan sisi beli yang lebih kuat. Ini sering menyokong kesinambungan bullish atau menandakan permintaan tersembunyi yang menyerap pesanan jual.
Garis di bawah 50 : Pasaran menunjukkan kecairan sisi jual yang lebih kuat. Ini sering menyokong kesinambungan bearish atau menandakan bekalan tersembunyi yang menyerap pesanan beli.
Rata atau hampir 50: Kecairan seimbang, mencadangkan ketidaktentuan atau pengukuhan.
Pilihan pelicinan: Pedagang boleh memilih antara pelicinan EMA atau KAMA untuk mengurangkan bunyi dan menumpukan pada trend kecairan dominan.
Cara Ia Berfungsi
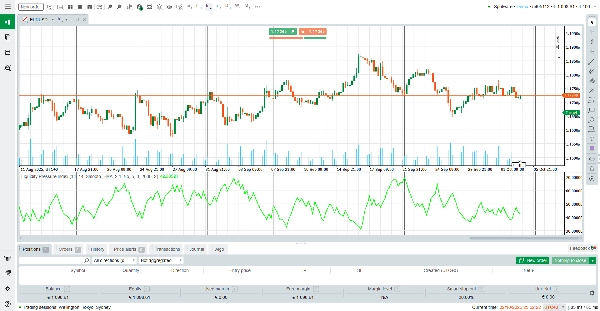
Penunjuk ini pertama mengukur volatiliti julat sebenar (ATR) dan membandingkannya dengan julat lilin sebenar untuk menganggarkan pemampatan. Ia kemudian menggabungkan ini dengan jumlah tick untuk memisahkan kecairan tertunda (pesanan yang menunggu dalam buku) daripada kecairan yang dilaksanakan (pesanan yang sudah dipenuhi). Bergantung pada arah lilin, algoritma mengagihkan penyerapan beli atau jual tersembunyi. Akhirnya, hasilnya dinormalkan terhadap EMA bergulung jumlah tick, diskalakan, dan dipelicin untuk kejelasan.
Hasilnya adalah indeks kecairan dinamik yang menyesuaikan diri dengan keadaan pasaran dan mendedahkan tarik-tali antara pembeli dan penjual secara masa nyata.
Ciri Utama
Wawasan Berfokus Kecairan: Melangkaui harga untuk mendedahkan tekanan beli/jual tersembunyi.
Pelicinan Adaptif: Pilih antara EMA atau KAMA untuk pengurangan bunyi.
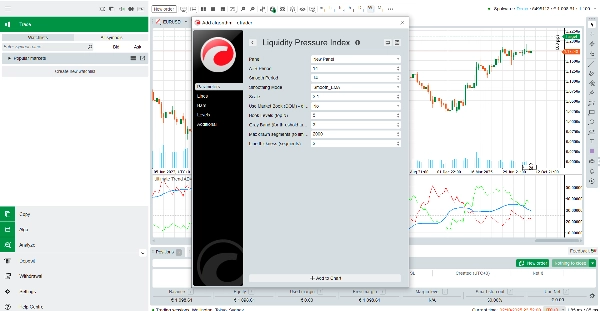
Parameter Boleh Disesuaikan: Kawal tempoh ATR, panjang pelicinan, skala, dan ketebalan garis.
Prestasi Dioptimumkan: Reka bentuk ringan dengan had segmen untuk memastikan carta berjalan lancar.
Mengapa Menggunakan Indeks Tekanan Kecairan?
Dalam pasaran yang bergerak pantas, harga sahaja boleh mengelirukan. Advanced Liquidity Balance membekalkan pedagang dengan perspektif yang lebih mendalam, menunjukkan sama ada pasaran benar-benar disokong oleh kecairan atau jika pergerakan berlaku dengan penyertaan yang lemah. Sama ada anda seorang scalper yang mencari ketidakseimbangan jangka pendek atau pedagang ayunan yang mengesahkan kekuatan trend, Indeks Tekanan Kecairan menyediakan lensa kecairan gred profesional—dan yang terbaik, ia adalah percuma sepenuhnya.
Muat turun hari ini dan tambahkan dimensi kejelasan baru kepada keputusan dagangan anda.
Ringkasan
Ulasan pelanggan
5 | 0 % | |
4 | 100 % | |
3 | 0 % | |
2 | 0 % | |
1 | 0 % |


![Logo "[Hamster-Coder] Moving Average MTF"](https://cdn.ctrader.com/image/webp/b11b98b1-194d-4b8e-b00e-d611826ad159_31226)

