
Penerangan
GAMBARAN KESELURUHAN
Penunjuk Waddah Attar Explosion (WAE) dicipta oleh Ahmad Waddah Attar dan diperkenalkan kepada komuniti perdagangan pada tahun 2007. Ia menggabungkan pengukuran momentum MACD dengan analisis volatiliti Bollinger Bands untuk mengenal pasti detik "letupan harga"—tempoh apabila harga beralih dari pengukuhan kepada pergerakan arah yang kuat.
Penunjuk ini menjawab dua soalan:
- Adakah momentum sedang meningkat? (diukur oleh kadar perubahan MACD)
- Adakah volatiliti sedang berkembang? (diukur oleh lebar Bollinger Bands)
Apabila kedua-dua syarat sejajar di atas penapis bunyi (Dead Zone), ia menandakan pergerakan letupan yang berpotensi.
KOMPONEN
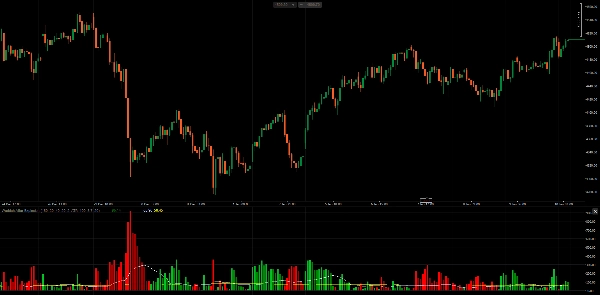
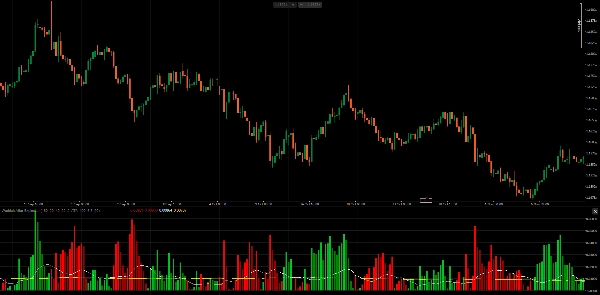
1. Histogram Trend (Hijau/Merah) Memaparkan kadar perubahan garis MACD, didarab dengan faktor kepekaan.
- Pengiraan:
(MACD_current - MACD_previous) × Sensitivity - Bar hijau: Momentum bullish (MACD mempercepat ke atas)
- Bar merah: Momentum bearish (MACD mempercepat ke bawah)
- Warna cerah: Momentum meningkat berbanding bar sebelumnya
- Warna gelap: Momentum menurun berbanding bar sebelumnya
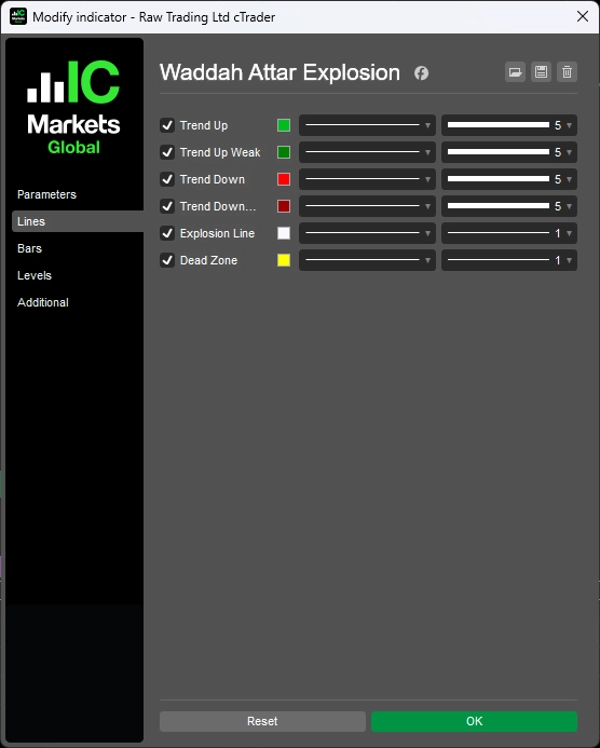
2. Garis Letupan (Putih) Mewakili lebar Bollinger Bands, menunjukkan perkembangan atau pengecutan volatiliti.
- Pengiraan:
BB_Upper - BB_Lower - Meningkat: Volatiliti berkembang (potensi breakout)
- Menurun: Volatiliti mengecut (pengukuhan)
3. Zon Mati (Kuning) Penapis ambang untuk menghapuskan isyarat lemah yang disebabkan oleh bunyi pasaran.
- Berasaskan ATR: Menyesuaikan dengan volatiliti pasaran semasa
- Pips Tetap: Nilai ambang statik
BAGAIMANA AHMAD WADDAH ATTAR MENGGUNAKANNYA
Menurut pengarang asal:
Peraturan Masuk untuk Beli Semua syarat mesti dipenuhi:
- Histogram hijau sedang meningkat
- Histogram hijau berada di atas Garis Letupan
- Garis Letupan sedang meningkat
- Kedua-dua histogram hijau dan Garis Letupan berada di atas Zon Mati
Peraturan Masuk untuk Jual Semua syarat mesti dipenuhi:
- Histogram merah sedang meningkat
- Histogram merah berada di atas Garis Letupan
- Garis Letupan sedang meningkat
- Kedua-dua histogram merah dan Garis Letupan berada di atas Zon Mati
Peraturan Keluar
- Keluar posisi panjang apabila histogram hijau melintasi ke bawah Garis Letupan
- Keluar posisi pendek apabila histogram merah melintasi ke bawah Garis Letupan
Pandangan Utama Sudut Garis Letupan adalah penting. Apabila Garis Letupan condong ke atas dan histogram memecah di atasnya, ini mengesahkan bahawa volatiliti sedang meningkat secara aktif—"letupan" adalah nyata, bukan isyarat palsu.
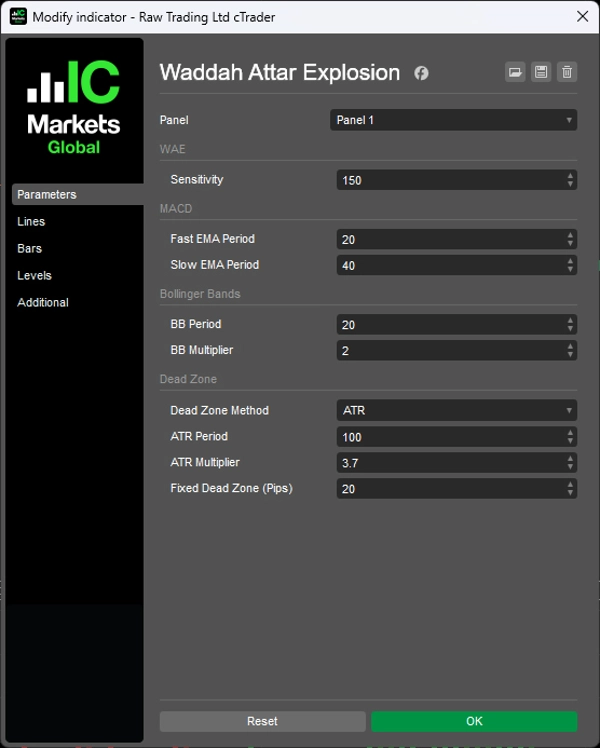
PARAMETER
1. Kepekaan
- Kepekaan (150): Pengganda untuk kadar perubahan MACD
2. MACD
- Tempoh EMA Pantas (20): Purata bergerak pantas untuk pengiraan MACD
- Tempoh EMA Perlahan (40): Purata bergerak perlahan untuk pengiraan MACD
3. Bollinger Bands
- Tempoh BB (20): Tempoh semakan Bollinger Bands
- Pengganda BB (2.0): Pengganda sisihan piawai
4. Zon Mati
- Kaedah Zon Mati (ATR): Pilih antara berasaskan ATR atau Pips Tetap
- Tempoh ATR (100): Tempoh untuk pengiraan ATR
- Pengganda ATR (3.7): Pengganda yang digunakan pada ATR untuk Zon Mati
- Zon Mati Tetap (20): Nilai Zon Mati dalam pips (apabila menggunakan kaedah Tetap)
CATATAN
- Penunjuk ini berfungsi pada semua jangka masa. Pengarang asal mengesyorkan H1 dan M30.
- Zon Mati berasaskan ATR disyorkan kerana ia menyesuaikan dengan instrumen dan keadaan pasaran yang berbeza.
- Parameter Kepekaan mungkin perlu disesuaikan berdasarkan jangka masa dan volatiliti instrumen.
- Penunjuk ini mengenal pasti penjajaran momentum dan volatiliti—ia tidak meramalkan arah secara sendiri. Pertimbangkan menggunakannya bersama analisis trend atau tahap sokongan/rintangan.
__________________________________________________________________________________________
LAGI PENUNJUK PERCUMA
Terokai pelbagai alat analisis pasaran—daripada struktur dan volum kepada regresi, volatiliti, dan jangka masa tersuai.
Kod sumber tersedia di repositori GitHub repository.
Semua percuma untuk digunakan. Tetapi jika anda ingin memberi sokongan kopi, anda boleh salurkannya di sini.
Sokongan/Rintangan
Volum
- Profiler Aktiviti Volum
- Penganalisis Kecekapan Volum
- Analitik Profil Volum
- Profil Volum - Dikemaskini
- Analisis Sebaran Volum
- VWAP (Harga Purata Berwajaran Volum)
Purata Bergerak
- Saluran SSL
- Purata Bergerak Berjangkar
- Purata Bergerak Skala Penyimpangan
- Pengaktif Tinggi Rendah Gann
- Garis Tren Segera
- Purata Bergerak Adaptif Kaufman dengan Visi Tren
- Saluran Purata Bergerak
- Set Purata Bergerak
- Purata Bergerak Saluran Tren
Utiliti/Tersuai
Berasaskan Regresi
Volatiliti
Osilator
__________________________________________________________________________________________
PENAFIAN
Perdagangan melibatkan risiko. Penunjuk ini bertujuan untuk analisis teknikal sahaja — sentiasa gunakan pengurusan risiko yang betul dan berdagang dengan bertanggungjawab.
MAKLUMBALAS & PENAMBAHBAIKAN
Jika anda mempunyai cadangan, permintaan ciri, atau idea untuk penambahbaikan, sila tinggalkan komen di tab Perbincangan. Maklumbalas anda membantu meningkatkan penunjuk untuk semua orang.


