Descripción
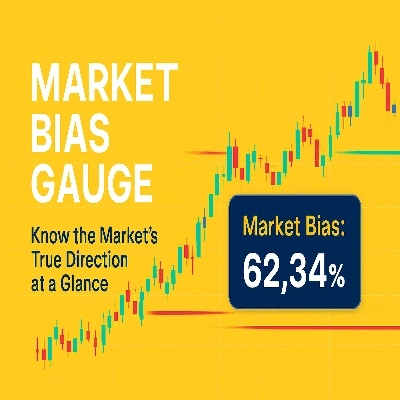
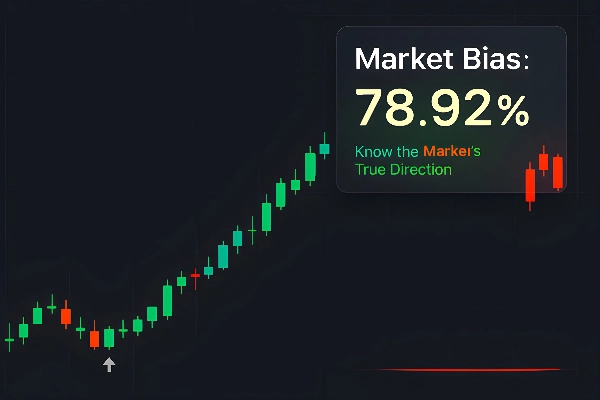
Indicador de Medidor de Sesgo del Mercado
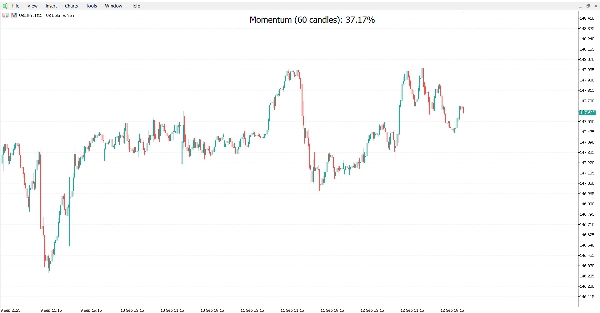
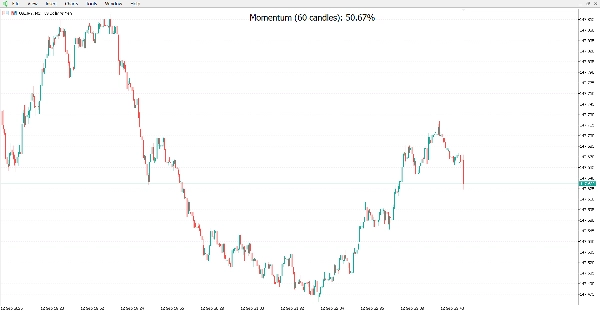
El Medidor de Sesgo del Mercado es una herramienta de análisis técnico diseñada para proporcionar a los traders una vista instantánea y clara del impulso del mercado, directamente en su gráfico. En lugar de configuraciones complejas o indicadores saturados, esta herramienta ofrece una métrica única y poderosa: el porcentaje de movimiento alcista frente a bajista durante el período que elijas.
Propósito de la Herramienta:
Esta herramienta tiene como objetivo ayudarte a evaluar instantáneamente si los compradores o vendedores están en control, lo que puede asistirte para tomar decisiones de trading más rápidas y confiables.
Cómo Leer el Porcentaje de Impulso:
Por debajo del 50%: Indica que domina el impulso bajista. Los vendedores son más fuertes que los compradores durante el período seleccionado, y el sesgo del mercado es a la baja.
Por encima del 50%: Indica que domina el impulso alcista. Los compradores son más fuertes que los vendedores durante el período seleccionado, y el sesgo del mercado es al alza.
Exactamente 50%: Indica que el mercado está equilibrado, sin un sesgo direccional claro.
Características:
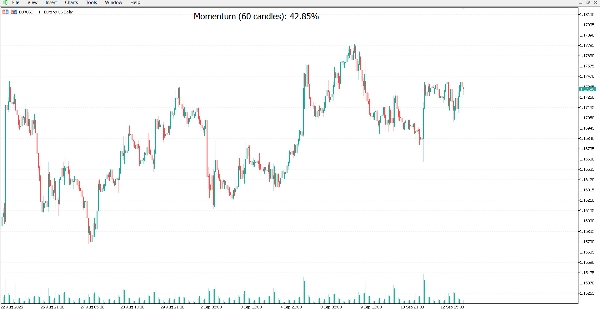
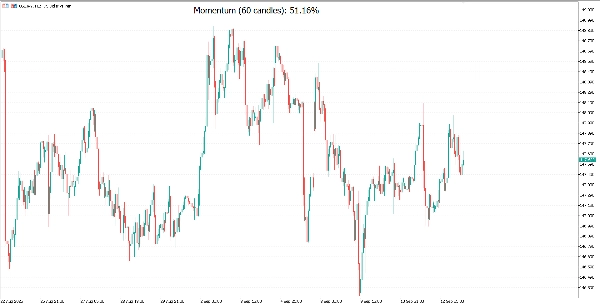
Lectura Instantánea del Impulso: Calcula el porcentaje de cambios de precio al alza frente a la baja en las últimas velas (por defecto: 60).
Visualización Clara en el Gráfico: Muestra el valor del impulso en texto grande y legible, perfectamente centrado en tu gráfico.
Apariencia Totalmente Personalizable: Elige tu fuente, tamaño y color preferidos para que coincidan con tu estilo de trading.
Detección de Mercado Neutral: Muestra una lectura equilibrada del 50% cuando el mercado no presenta movimiento neto.
Ligero y Rápido: Funciona sin problemas en cualquier gráfico, incluso con grandes conjuntos de datos o trading en vivo.
Actualizaciones Dinámicas: Se actualiza automáticamente con cada nueva vela, manteniéndote sincronizado con el mercado.
Por Qué a los Traders les Puede Encantar:
Sin Adivinanzas: Ve el sesgo del mercado de un solo vistazo.
Mejor Sincronización: Detecta cambios en el impulso antes de que aparezcan en indicadores tradicionales.
Compañero Perfecto: Funciona junto con tu estrategia existente sin añadir desorden al gráfico.
Aviso Legal
El Medidor de Sesgo del Mercado es una herramienta de análisis técnico destinada únicamente a fines informativos y analíticos. Esta herramienta no proporciona asesoramiento financiero o de inversión y no garantiza ganancias. Operar en los mercados financieros implica un riesgo significativo y puede resultar en la pérdida de tu capital. Eres el único responsable de tus decisiones de inversión. Debes usar esta herramienta como parte de una estrategia de trading integral que incluya gestión de riesgos.
Resumen
Valoraciones de clientes
5 | 0 % | |
4 | 100 % | |
3 | 0 % | |
2 | 0 % | |
1 | 0 % |


