Logo "Multi-Level Candle Bias Tracker"
Indikator
855 muat turun
Versi 1.0, Jan 2025
Windows, Mac
5.0
Ulasan: 1
Imej yang dimuat naik "Multi-Level Candle Bias Tracker"
Sejak 03/10/2024
153
Jualan
35.7K
Pemasangan percuma

Penunjuk Kedai Pinescriptlabs:                        Pinescriptlabs  Kedai cBots :  (cBot) Gold & BTC BreakoutSession Pivots(baru)

Algoritma Pintar Trailing (Baru)

S&R ZigZag Struktur                                

ZigZag

 BOS & CHOCH

Zon Bekalan Permintaan

Peta Likuidasi Leverage

Saluran Auto-Trend


Peta Haba Volume POC


SALURAN SSL PREMIUM

Ramalan Berdasarkan Linreg & ATR

 Kuasa ICT 3 
                                                   

Sokongan SmartTrend &
Rintangan
Garis
       

Sesi Jurang Nilai Adil           


Pencetus Trend RSI

Sistem Pecah Saluran

Supertrend

Ketidakseimbangan Pasaran

Saluran Trend Adaptif 

Dinamik
Struktur Pasaran
Analisis
dari
Titik
Pusingan

Blok Pesanan

Fibonacci
Regresi
Linear
Berbilang jangka masa
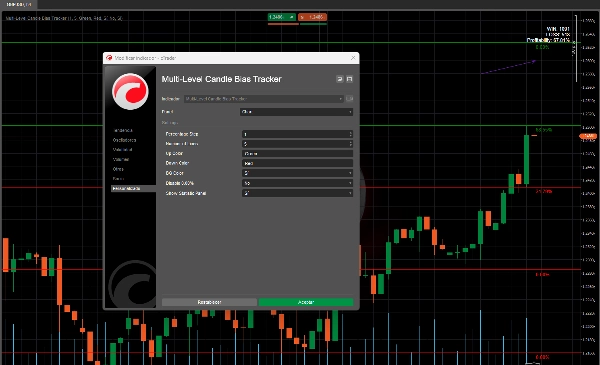
RSI Dinamik

Jurang Nilai Adil Momentum

Unjuran Aliran Pasaran

Kecerunan Trend Dinamik

Berbilang Tahap
Bias Lilin
Penjejak

Penjejak Ekstremiti Zig-Zag

Purata Bergerak Reaktif

Auto
Sokongan dan
Rintangan
Trend
Garis

Semua
Sokongan dan
Rintangan
Tahap

Momentum Julat Dinamik

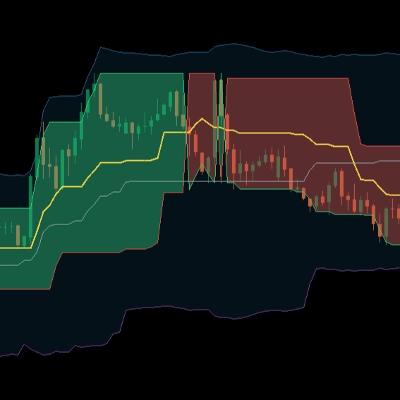
Algoritma ini menentukan kebarangkalian harga mencapai paras tinggi atau rendah baru dan mewakilkannya sebagai tahap pada carta, disertai dengan peratusan yang sepadan. Pengiraan ini diuji semula, dan hasilnya dipaparkan dalam jadual, memudahkan pemahaman tentang kebarangkalian lilin seterusnya menetapkan paras tinggi atau rendah baru. 📈📉

Bagaimana ia berfungsi? 🛠️

  1. Kebarangkalian Paras Tinggi dan Rendah Baru 🎯
    • Algoritma menganalisis tingkah laku harga lalu untuk mengira kebarangkalian harga mencapai paras tinggi atau rendah baru dalam lilin seterusnya.
    • Contohnya, jika kebarangkalian paras tinggi baru adalah 70%, harga lebih cenderung naik. ⬆️
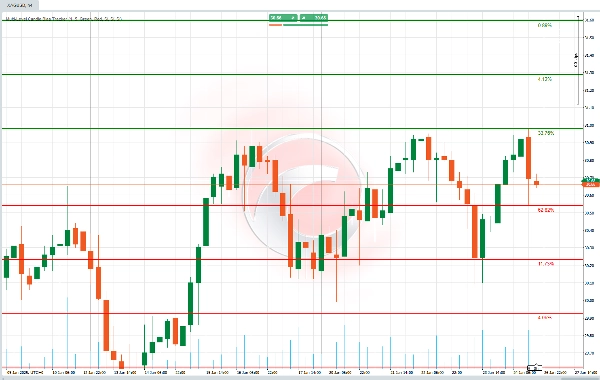
  2. Tahap dengan Peratusan 📏
    • Ia melukis garis mendatar pada carta yang mewakili tahap utama, bersama dengan peratusan yang menunjukkan kebarangkalian harga mencapai tahap tersebut.
    • Tahap ini dikira menggunakan peratusan yang anda tetapkan (contohnya, 1%).
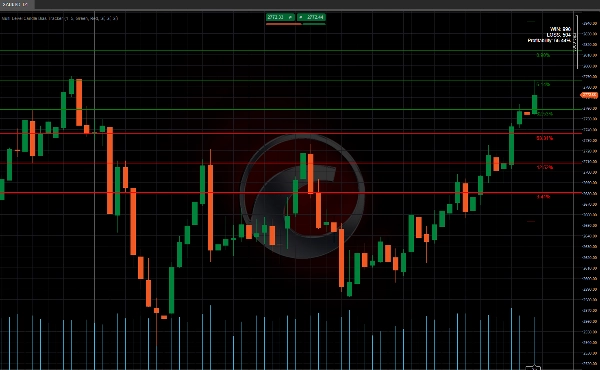
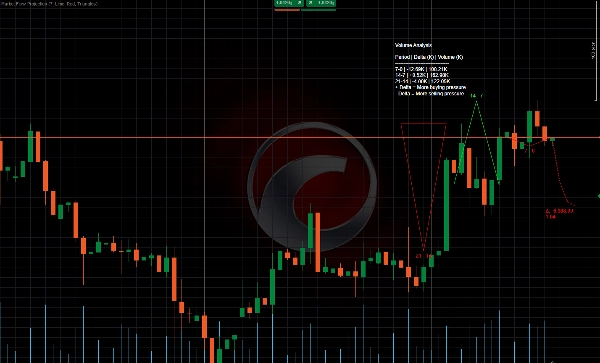
  3. Panel Statistik 📊
    • Ia menunjukkan berapa kali harga telah mencapai tahap tersebut (kejayaan) dan berapa kali tidak.
    • Ia juga menyediakan peratusan keberkesanan, memberitahu anda jika tahap tersebut boleh dipercayai pada masa lalu. ✅❌

Untuk apa ia digunakan? 

  • Memahami arah harga: Membantu anda mengetahui sama ada harga lebih cenderung naik atau turun dalam lilin seterusnya. ⬆️⬇️
  • Mengurus risiko: Jika sesuatu tahap mempunyai kebarangkalian rendah, anda boleh mengelakkannya untuk mengurangkan keputusan berisiko.

Bagaimana anda menggunakannya? 

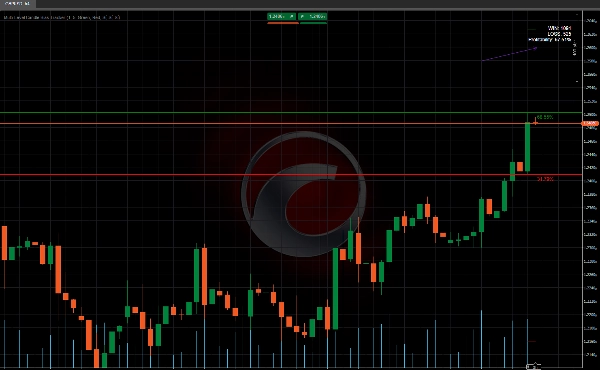
  1. Perhatikan tahap: Lihat garis yang dilukis algoritma pada carta. 👀
  2. Semak kebarangkalian: Jika sesuatu tahap mempunyai kebarangkalian tinggi (contohnya, 70%), harga lebih cenderung mencapainya. 📈
  3. Gunakan panel statistik: Semak sama ada tahap tersebut berfungsi dengan baik pada masa lalu untuk memutuskan sama ada anda mempercayainya. 📊


Profil indikator
5.0
Ulasan: 1
5
100 %
4
0 %
3
0 %
2
0 %
1
0 %
Ulasan pelanggan
July 14, 2025
Pros: Visualizes candle bias across multiple timeframes. Clean interface, helpful for multi-TF trend confirmation. Cons: No alerts or tooltips. Bias logic is basic. Lacks template saving and signal confirmation features.
BTCUSD
Breakout
Supertrend
Commodities
RSI
Crypto
XAUUSD
Produk yang tersedia melalui cTrader Store, termasuk bot dagangan, indikator dan plugin, disediakan oleh pembangun pihak ketiga dan diberikan akses untuk tujuan maklumat dan teknikal sahaja. cTrader Store bukan broker dan tidak memberikan nasihat pelaburan, syor peribadi atau sebarang jaminan prestasi masa hadapan.

Lebih banyak produk daripada penulis ini

Logo "ZigZag"
Dinilai teratas
4.3
(6)
Percuma
Indikator
ATR
RSI
+7
ZigZag filters noise, spots trends, patterns, pivots, aiding analysis, trade management, and confirmations. 📉📈
Indikator
ATR
RSI
+7
Identify bullish and bearish Order Blocks to spot key support/resistance levels and potential trend reversals! 📈🔄
Indikator
ATR
RSI
+7
📊 Shows volume by price levels, highlights POC, and key zones. Identifies dynamic support/resistance and imbalances.
Indikator
ATR
RSI
+6
Market structural patterns , specifically the concepts of Change of Character (ChoCH) 🔄 and Break of Structure (BoS) 💥
Indikator
ATR
RSI
+6
Adaptive trend channel using linear regression and Pearson correlation for dynamic support, resistance, and trends.
Indikator
RSI
Breakout
+1
"Identify key market zones and visualize support/resistance from multiple timeframes on a single chart.
Indikator
ATR
RSI
+7
identify and highlight temporary market inefficiencies known as "fair value gaps" 🚨 within specific trading Sessions.
Indikator
ATR
RSI
+6
💹 Define a price channel 📈 and determine trend direction (bullish 🟢 or bearish 🔴).
Indikator
ATR
RSI
+6
📊Zones Supply & Demand: Identifies key price levels with high volume concentration, marking Supply/Demand Zones & Marke
Indikator
RSI
BTCUSD
+5
Identify market structure effortlessly with swing highs, lows, CHoCH, and BOS levels for smart trading decisions! 📊🔍"
Indikator
ATR
RSI
+8
Detects bullish and bearish divergences
Indikator
Advanced price action tool that combines multiple technical analysis concepts

Anda juga mungkin suka

Indikator
SMC
Prop
+16
Multi-Time Frame Candlesticks FVG with BSL/SSL Premium Suite
Indikator
Flag
Key Levels
+5
Zig Zag filters out minor price noise and connects only the most significant swing and lows for key turning points.
Indikator
Indices
Breakout
+1
You can use the cTrader Pivot Points Pro indicator to find a good pullback entry in a trend
Indikator
Key Levels
Supply & Demand
+2
Institutional Levels Pro is an essential tool for traders who rely on price action and institutional market structure.
Indikator
BOS
VWAP
+4
Gold premiun XAUUSD Exclusive Real-Time Adaptive Intelligence
Indikator
MACD
Forex
+1
Swing-Trading Indicaotr for pairs like EUR/USD, AUD/USD, and USD/JPY. Most effective on higher time frames H4,H6,H12...
Indikator
RSI
VegaXLR's cTrader StochRSI identifies overbought/oversold RSI levels for precise trade entries.
Indikator
Forex
BTCUSD
+10
Automate your price action analysis with stable, time-anchored Support & Resistance zones that adapt to breakouts in rea
Indikator
Volume
Order Block
+4
Volume Profile with fixed period, custom range and buy/sell pressure.
Indikator
Forex
Crypto
+4
Auto Trend Line Indicator for cTrader
Indikator
Prop
Forex
+4
Displays real-time balance, equity, P&L, margin metrics directly on your charts.
Indikator
BOS
CHOCH
+3
Smart Money Concepts Pro v5.1 for cTrader is a structural market analysis indicator that identifies swings, BOS, CHoC
Indikator
ATR
Flag
+5
Decision panel with Buy/Sell scores, market bias, setup quality, trading cost and clear trade reasons.
Indikator
Forex
Signal
+1
Great signal indicator, works with bollinger bands and heikin ashi candles! one of our latest innovations!
Indikator
Forex
cTrader ZigZag Alerts: Precision Swing Detection, Alerts, and Fibonacci.
Indikator
SMC
Forex
+5
Pure Price Action ICT Tools
Indikator
cTreder Smart SMA
Indikator
MACD
Prop
+14
Enhance MACD Histogram! Visualize bull and bear price changes with vibrant colors for clearer, more insightful trading.
Sejak 03/10/2024
153
Jualan
35.7K
Pemasangan percuma