Penerangan
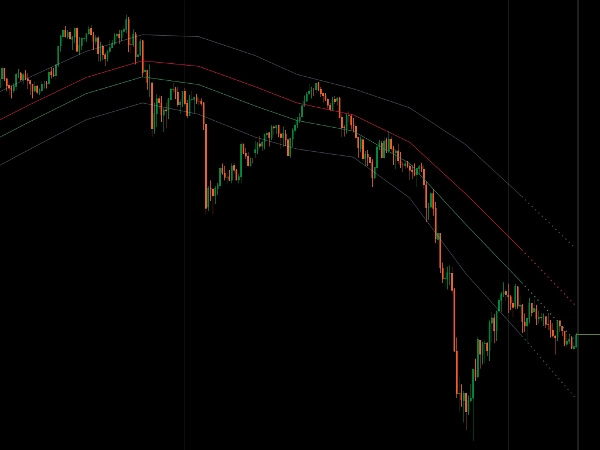
Saluran harga dinamik menggunakan purata bergerak pada keempat-empat harga OHLC untuk analisis struktur pasaran yang lengkap.
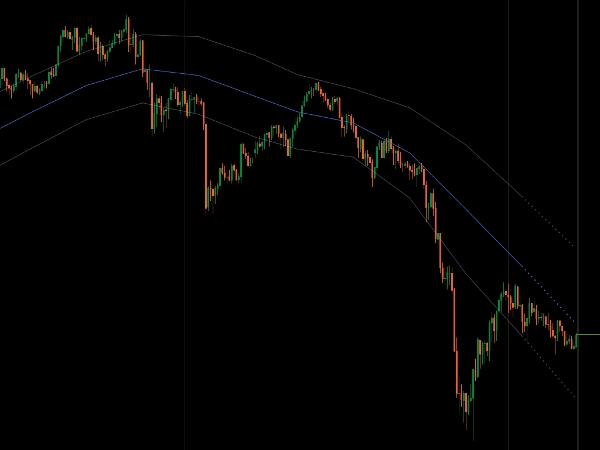
Menggunakan jenis MA pilihan anda (Simple, Eksponen, Wilder, Skala Penyimpangan, SuperSmoother, Hull) pada sempadan Tinggi/Rendah, bias arah Buka/Tutup, dan garis keseimbangan Median untuk visualisasi saluran yang padu.
Zon pembalikan Fibonacci terbina dalam (38.2%, 61.8%), lapisan pelicinan berganda untuk SMA/EMA menghasilkan saluran yang sangat bersih, paparan pelbagai jangka masa dengan mod tangga tradisional atau garis tren serong, unjuran pintar berasaskan momentum, dan pengesanan penolakan sempadan memberikan struktur saluran yang menyeluruh untuk pedagang yang mensasarkan pembalikan purata dan penilaian kekuatan tren merentasi jangka masa.
CIRI-CIRI
Struktur Harga Lengkap
- Tinggi/Rendah menentukan sempadan saluran
- Buka/Tutup menunjukkan bias arah
- Garis Median: tahap 50% antara Tinggi/Rendah—pusat sebenar keseimbangan pasaran
- Empat harga bekerja bersama untuk menunjukkan gambaran pasaran yang lengkap
Zon Pembalikan Terbina Dalam
- Tahap Fibonacci 38.2% dan 61.8% menandakan kawasan penarikan balik yang signifikan secara statistik
- Zon dinamik yang menyesuaikan dengan pergerakan harga
- Titik rujukan masuk dan keluar yang jelas
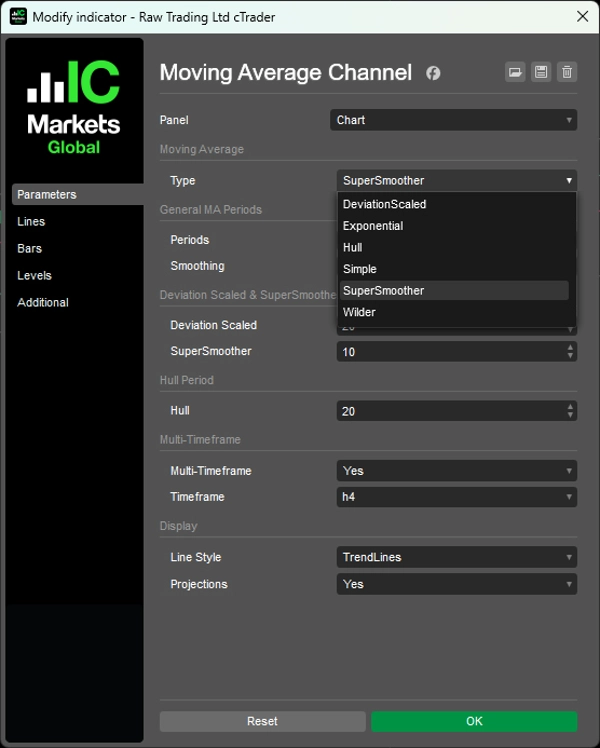
6 Jenis Purata Bergerak
- Simple, Eksponen, Wilder, Skala Penyimpangan, SuperSmoother, Hull
- Pelicinan berganda untuk SMA/EMA: Tempoh + lapisan pelicinan tambahan untuk saluran yang sangat bersih
- Algoritma maju: Skala Penyimpangan menyesuaikan dengan volatiliti, SuperSmoother menghapuskan kelewatan, Hull menekankan tindakan harga terkini
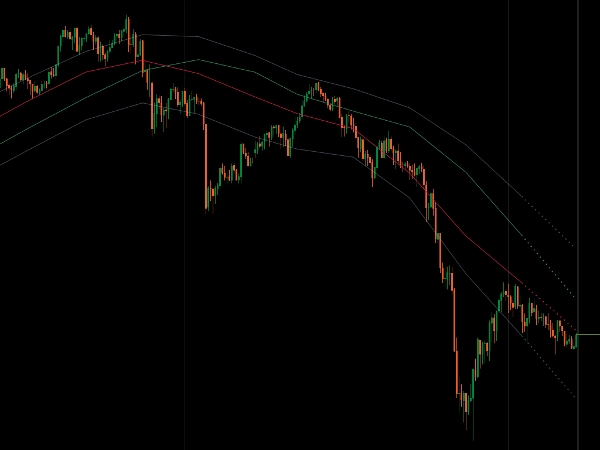
Pelbagai Jangka Masa dengan Garis Tren
- Lihat saluran jangka masa lebih tinggi pada carta jangka masa lebih rendah
- Dua mod paparan: Garis tangga tradisional atau garis tren serong (MTF sahaja)
- Garis menghubungkan penutupan bar MTF untuk struktur serong yang bersih
- Unjuran pintar menunjukkan arah saluran berdasarkan momentum semasa
Sistem Visual Bersih
- Kecerunan saluran menunjukkan momentum
- Posisi harga menunjukkan kekuatan tren
- Penolakan sempadan memberi isyarat kemungkinan pembalikan
- Satu indikator untuk analisis struktur pasaran yang lengkap
__________________________________________________________________________________________
INDIKATOR PERCUMA LAIN
Terokai pelbagai alat analisis pasaran—dari struktur dan volum hingga regresi, volatiliti, dan jangka masa tersuai.
Kod sumber tersedia di repositori GitHub.
Semua percuma untuk digunakan. Tetapi jika anda ingin menyokong dengan kopi, anda boleh salurkan ia di sini.
Sokongan/Perlawanan
Volum
- Profiler Aktiviti Volum
- Penganalisis Kecekapan Volum
- Analitik Profil Volum
- Profil Volum - Dikemaskini
- Analisis Sebaran Volum
- VWAP (Harga Purata Berwajaran Volum)
Purata Bergerak
- Saluran SSL
- Purata Bergerak Berjangkar
- Purata Bergerak Skala Penyimpangan
- Pengaktif Tinggi Rendah Gann
- Garis Tren Segera
- Purata Bergerak Adaptif Kaufman dengan Visi Tren
- Saluran Purata Bergerak
- Suite Purata Bergerak
- Purata Bergerak Saluran Tren
Utiliti/Tersuai
Berasaskan Regresi
Volatiliti
Osilator
__________________________________________________________________________________________
PENAFIAN
Perdagangan melibatkan risiko. Penunjuk ini bertujuan untuk analisis teknikal sahaja — sentiasa gunakan pengurusan risiko yang betul dan berdagang dengan bertanggungjawab.
MAKLUMBALAS & PENAMBAHBAIKAN
Jika anda mempunyai cadangan, permintaan ciri, atau idea untuk penambahbaikan, sila tinggalkan komen di tab Perbincangan. Maklumbalas anda membantu memperbaiki penunjuk untuk semua orang.
Ringkasan
The indicator incorporates built-in Fibonacci reversion zones at 38.2% and 61.8%, which dynamically adjust with price movement to highlight significant pullback areas and provide clear entry and exit reference points. It supports multi-timeframe analysis, allowing higher timeframe channels to be displayed on lower timeframe charts, with two visualization modes: traditional stairstep lines or diagonal trendlines connecting multi-timeframe bar closes. Smart momentum-based projections indicate potential channel direction, while boundary rejection detection signals possible reversals.
This tool offers a cohesive visual system where channel slope reflects momentum and price position indicates trend strength, enabling traders to assess trend direction, momentum shifts, and mean reversion zones across various markets including Forex, Indices, Commodities, Crypto, and Stocks.