
Volume Meter
Indicador
2 compras
Versão 1.0, Sep 2025
Windows, Mac
5.0
Avaliações: 1
Descrição
📘 O que este indicador faz
- Ele mostra volume de ticks (número de mudanças de preço por barra) como um histograma.
- No Forex, os corretores raramente fornecem volume real negociado, então o volume de ticks é usado como um substituto.
- Em ações/CFDs/futuros, você pode obter o volume real.
- Ele sobrepõe uma Média Móvel do volume (padrão de 20 períodos).
- Isso atua como uma “linha de base” para identificar rapidamente se o volume da barra atual está incomumente alto ou baixo.
🎯 Como usar como confirmação
O indicador não é um gerador de sinal independente. Em vez disso, os traders o usam para confirmar configurações de outras estratégias:
- Confirmação de rompimento
-
- Se o preço romper acima da resistência ou abaixo do suporte, verifique se a vela do rompimento tem volume acima da sua MM.
- Volume alto confirma que mais participantes estão por trás do movimento → o rompimento é mais confiável.
- Rompimento com volume baixo = maior chance de falso rompimento.
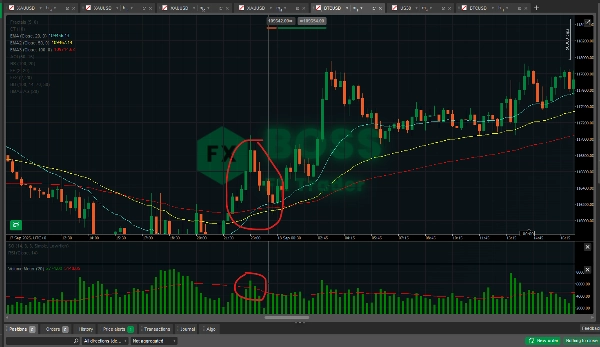
- Continuação de tendência vs. exaustão
-
- Em uma tendência forte, velas de retração geralmente têm volume menor comparado às velas de impulso.
- Se uma retração ocorre com volume baixo e o próximo movimento retoma com volume maior → confirma continuação da tendência.
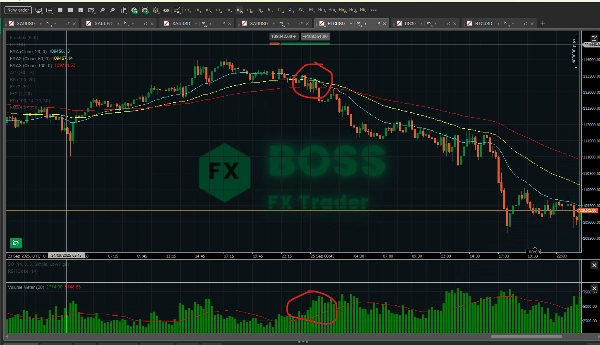
- Se você vê a pressão da tendência continuando mas o volume caindo a cada impulso → possível exaustão, prepare-se para reversão.
- Confirmação de reversão
-
- Grandes velas de reversão (pin bars, velas engolfantes, fractais) são mais fortes se apoiadas por um pico de volume.
- Exemplo: pin bar de alta no suporte com volume alto = sinal de reversão mais forte do que o mesmo pin bar com volume baixo.
- Filtro de sinais falsos
-
- Se seu sistema principal der um sinal de compra/venda, mas o volume estiver fraco (abaixo da média), você pode optar por não entrar nessa operação.
- Ajuda a reduzir overtrading e filtrar ruído.
📊 Efetividade
- No Forex: O volume de ticks tem mostrado forte correlação com o volume real negociado (70–90% de correlação em muitos estudos). Portanto, é útil, mas não perfeito.
- Em Ações/Futuros/CFDs: O volume real torna isso muito mais poderoso, pois você está medindo contratos/ações realmente negociados.
- Como confirmação: É melhor usado com ação de preço e outros indicadores (ex.: EMA, RSI, fractais). Confiar apenas no volume é arriscado.
- Pontos fortes: Confirma rompimentos, filtra movimentos falsos, identifica exaustão.
- Pontos fracos: Não prevê a direção por si só — apenas aumenta a confiança quando você já tem uma configuração.
✅ Dica prática:
Use o indicador como um filtro, não como um gatilho. Por exemplo:
- Você vê um cruzamento de EMA (sinal de compra).
- Verifique: o volume está acima da sua média móvel? Se sim → faça a operação. Se não → espere.
Dessa forma, você só negocia quando o momentum é apoiado pela participação do mercado.
Resumo
Resumo de IA
Volume Meter is a trading indicator that displays tick volume—the number of price changes per bar—as a histogram. In Forex markets, where real traded volume data is often unavailable, tick volume serves as a proxy, while in stocks, CFDs, and futures, real volume data may be used. The indicator overlays a moving average of volume (default 20-period) to provide a baseline, helping traders identify whether current volume is unusually high or low.
This tool is designed to confirm trading setups rather than generate standalone signals. It assists in validating breakouts by checking if breakout candles have volume above their moving average, indicating stronger market participation. It also helps distinguish trend continuation from exhaustion by comparing volume levels during pullbacks and impulse moves. Additionally, it supports reversal confirmation by highlighting volume spikes on significant reversal candles and filters false signals by advising caution when volume is weak despite buy or sell signals from other systems.
Volume Meter is applicable across various markets including Forex, stocks, indices, commodities, and cryptocurrencies. Its effectiveness is enhanced when combined with price action and other indicators such as EMA or RSI. The indicator aids in improving trade decision confidence by integrating volume analysis as a confirmation and filtering tool.
Perfil do indicador
Avaliações de clientes
5.0
Avaliações: 1
5 | 100 % | |
4 | 0 % | |
3 | 0 % | |
2 | 0 % | |
1 | 0 % |
Avaliações de clientes
October 1, 2025
the first 10 trades should stay boring, and the checklist becomes easier to follow.
Conversa
Perguntas frequentes
BTCUSD
Forex
Breakout
Indices
EURUSD
Commodities
GBPUSD
NZDUSD
Prop
Supertrend
Crypto
Stocks
XAUUSD
NAS100
USDJPY
Os produtos disponíveis através da cTrader Store, incluindo bots de negociação, indicadores e plugins, são fornecidos por programadores terceiros e são disponibilizados apenas para fins informativos e de acesso técnico. A cTrader Store não é um corretor e não fornece aconselhamento em matéria de investimento, recomendações pessoais ou qualquer garantia de desempenho no futuro.


Preço
Desde 29/05/2025
3.04M
Volume negociado
45.22K
Pips ganhos
29
Vendas
769
Instalações gratuitas