

Penerangan
1️⃣ Apa Fungsi Penunjuk Ini?
Alat ini meringkaskan arah lilin merentasi pelbagai jangka masa di satu tempat pada carta anda.
Untuk setiap jangka masa, ia memeriksa lilin yang ditutup terakhir dan memaparkan:
StatusMaksud
🟢 Bull
Tutup > Buka (pembeli mengawal)
🔴 Bear
Tutup < Buka (penjual mengawal)
⚪ Doji
Tutup ≈ Buka (ketidaktentuan)
Jangka masa yang dipaparkan:
- Harian
- H4
- H1
- M30
- M15
- M5
Semua status dipaparkan pada carta itu sendiri, jadi anda tidak perlu menukar jangka masa.
2️⃣ Kenapa Alat Ini Berkuasa
🔥 Menyelesaikan Masalah Biasa Pedagang
Kebanyakan pedagang bertanya:
“Adakah saya berdagang dengan atau melawan trend jangka masa lebih tinggi?”
Penunjuk ini menjawab itu dengan segera.
Daripada meneka:
- Anda melihat penyelarasan trend
- Anda mengelakkan entri bertentangan trend
- Anda memperbaiki masa & keyakinan
3️⃣ Bagaimana Penunjuk Berfungsi
📌 Logik Status Lilin
- Menggunakan lilin yang ditutup terakhir (
Last(1)) - Tiada cat semula
- Pengesahan yang boleh dipercayai
📌 Data Pelbagai Jangka Masa
- Mengambil data lilin sebenar dari setiap jangka masa
- Bebas daripada jangka masa carta yang anda sedang gunakan
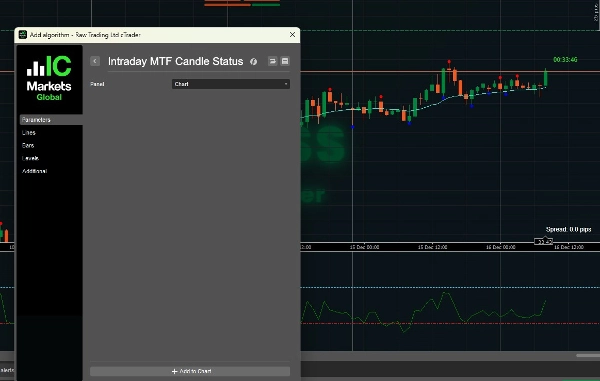
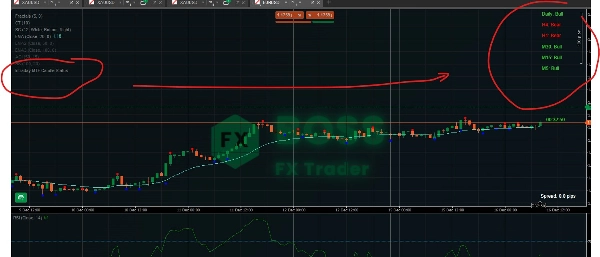
📌 Paparan Pada Carta
- Melukis label teks di kawasan kanan atas
- Berwarna untuk bacaan segera
- Dikemas kini pada setiap tik
4️⃣ Cara Menggunakannya Dengan Berkesan (Senario Perdagangan)
🟢 Senario 1: Pengesahan Trend (Kes Penggunaan Terbaik)
✔ Peraturan:
Berdagang hanya apabila jangka masa lebih tinggi dan lebih rendah bersetuju
Contoh:
Harian: Bull
H4: Bull
H1: Bull
M15: Bull
M5: Bull
✅ Persekitaran BELI berkemungkinan tinggi
Gunakan:
- Tarikan balik
- Pecahan
- Entri sambungan
❌ Elakkan JUALAN di sini
🔴 Senario 2: Amaran Bertentangan Trend
Harian: Bull
H4: Bull
H1: Bear
M15: Bear
M5: Bear
⚠️ Pasaran berada dalam tarikan balik, bukan pembalikan.
Tindakan terbaik:
- Tunggu M5/M15 kembali menjadi Bull semula
- Elakkan mengejar JUALAN
- Cari setup beli di sokongan
⚪ Senario 3: Pasaran Berombak / Berjulat
Harian: Bull
H4: Doji
H1: Doji
M15: Bear
M5: Bull
🚫 Keadaan berkualiti rendah
Disyorkan:
- Kurangkan saiz posisi
- Elakkan perdagangan pecahan
- Tunggu kejelasan struktur
5️⃣ Contoh Strategi Scalping (Entri M5)
🔹 Setup Beli Ideal
- Harian → Bull
- H4 → Bull
- H1 → Bull
- M15 → Bull
- M5 → Bear → bertukar menjadi Bull
📍 Entri:
- Apabila M5 kembali menjadi Bull
- Gabungkan dengan:
-
- Sokongan
- Fraktal
- EMA / VWAP
🔹 Setup Jual Ideal
Logik bertentangan:
- Jangka masa lebih tinggi → Bear
- Masuk pada penyempurnaan tarikan balik M5
6️⃣ Gabungan Jangka Masa Terbaik
Gaya PerdaganganJangka Masa Fokus
Scalping
H1 → M15 → M5
Intraday
H4 → H1 → M15
Swing
Harian → H4 → H1
7️⃣ Apa Yang Alat Ini BUKAN
🚫 Bukan isyarat masuk sendiri
🚫 Bukan penunjuk pembalikan
🚫 Bukan pengganti struktur / tindakan harga
✅ Ia adalah alat bias & pengesahan
8️⃣ Penunjuk Terbaik Untuk Digabungkan
Gabungan yang sangat disyorkan:
- ✅ Fraktal (anda sudah menggunakannya)
- ✅ Struktur pasaran (HH / LL)
- ✅ Sokongan & Rintangan
- ✅ EMA 50 / EMA 200
- ✅ VWAP
9️⃣ Peraturan Perdagangan Pro Menggunakan Alat Ini
✔ Berdagang hanya mengikut arah HTF
✔ Gunakan LTF hanya untuk masa masuk
✔ Abaikan isyarat apabila Harian & H4 tidak sependapat
✔ Jangan berdagang berlebihan semasa isyarat bercampur
✔ Biarkan struktur mengesahkan bias lilin
🔟 Ringkasan Akhir
IntradyMultiTimeframeCandleStatus = Papan Pemuka Bias Pasaran
Ia memberi anda:
- Kejelasan trend segera
- Perdagangan dengan kebarangkalian lebih tinggi
- Keputusan kurang emosi
- Pelaksanaan lebih bersih
Lihat produk kami.
Ringkasan
Ulasan pelanggan
5 | 100 % | |
4 | 0 % | |
3 | 0 % | |
2 | 0 % | |
1 | 0 % |


