
E7 Harmonic Structures Basic
Gösterge
645 i̇ndirmeler
Sürüm 1.0, Feb 2025
Windows, Mac
5.0
Değerlendirmeler: 2
Açıklama
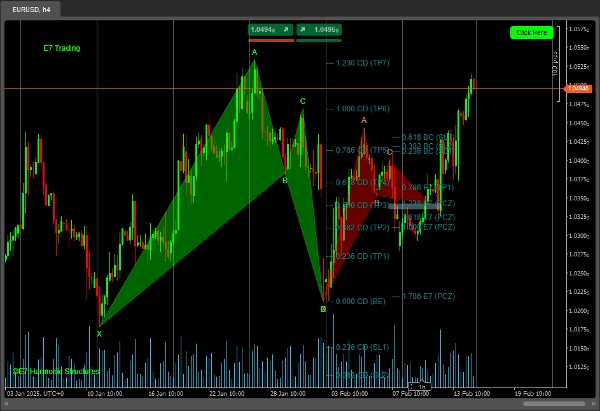
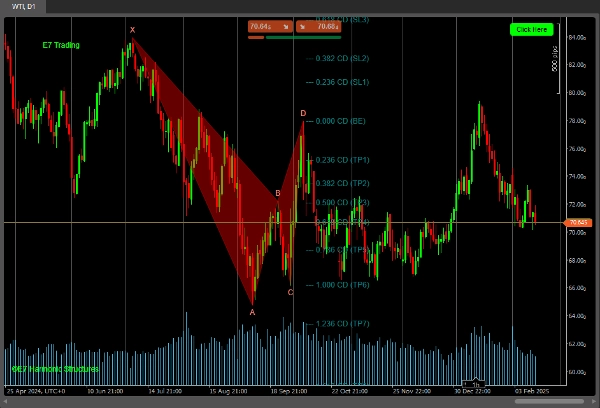
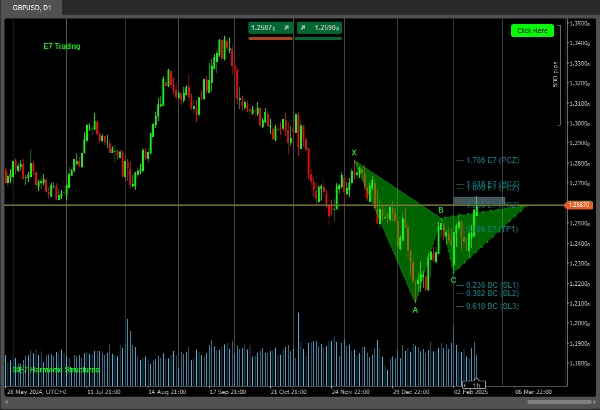
E7 Harmonik Yapılar Temel göstergesi şunları içerir:
Nokta 'C' Yapıları ve Nokta 'D' Yapıları.
Daha iyi analiz için Fib Projeksiyonları, PCZ ve PRZ, E7 Stratejilerinde öğretildiği gibi.
Ancak, yalnızca aşağıdaki Yapıların sınırlı sayısını içerir:
- Gartley
- Bat
- Butterfly
- Crab
- Cypher
* Bu bir Beta sürümüdür.
Tam gösterge, çok daha fazla Yapı içerir ve yakında geliyor.
İyi avlar!
Özet
YZ özeti
E7 Harmonic Structures Basic is a technical indicator designed for harmonic pattern analysis in trading. It identifies Point 'C' and Point 'D' structures and incorporates Fibonacci projections, Potential Completion Zones (PCZ), and Potential Reversal Zones (PRZ) to support detailed market analysis as outlined in E7 Strategies. The indicator currently detects a limited set of harmonic patterns, including Gartley, Bat, Butterfly, Crab, and Cypher formations. This version is labeled as Beta, with a more comprehensive version including additional structures planned for future release.
Gösterge profili
Müşteri değerlendirmeleri
5.0
Değerlendirmeler: 2
5 | 100 % | |
4 | 0 % | |
3 | 0 % | |
2 | 0 % | |
1 | 0 % |
Müşteri değerlendirmeleri
August 12, 2025
Pros: Detects Bat, Gartley, Butterfly, Shark patterns automatically with PRZ visualization. Flexible settings. Cons: No tooltips or alerts. Missing pattern history log and template saving. Requires external confirmation (volume or PA).
April 22, 2025
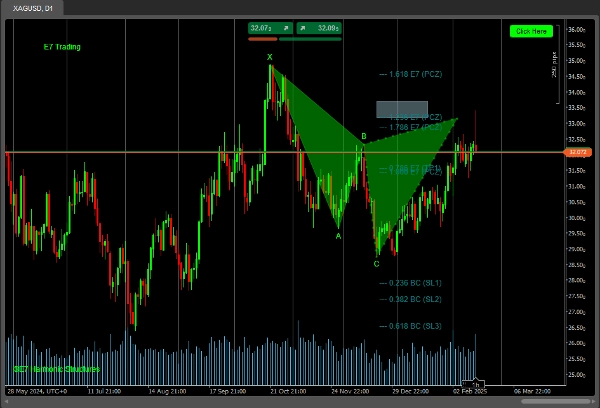
I am currently testing your indicator and I must say it is very interesting. I am a fan of Fibonacci and today, April 22, 2025, it showed two beautiful structures on gold. Like from a book about trading. Best regards and I wish you continued success in improving the product. Artur
Tartışma
SSS
cTrader Store üzerinden erişilebilen işlem botları, göstergeler ve eklentiler gibi ürünler, üçüncü taraf sağlayıcılar tarafından sağlanır ve yalnızca bilgilendirme ve teknik erişim amaçlarıyla sunulur. cTrader Store bir broker değildir ve yatırım tavsiyesi, kişisel öneriler vermez veya gelecekteki performansı garanti etmez.
Bu oluşturanın diğer ürünleri


Şunları da beğenebilirsiniz


Fiyat
Başlangıç 18/12/2024
2
Satışlar
4.24K
Ücretsiz yüklemeler