📊 VPOC 몬테카를로 기대값
https://chartshots.spotware.com/c/69c558e2c68df
통합 시장 분석: 볼륨 프로필 + 통계적 예측 🎯
🎯 이것은 무엇인가요?
VPOC 몬테카를로 기대값은 두 가지 전문 거래 방법론을 결합한 정량적 분석 지표입니다:
- 시장 깊이 프로필 (VPOC) - 실제로 볼륨이 집중된 위치를 식별합니다 🏦
- 몬테카를로 시뮬레이션 - 통계적 확률에 기반한 미래 시나리오 예측 📈
결과는 돈이 어디에 있는지(통제점)와 어디로 갈 가능성이 있는지(예상 기대값)를 알려주는 분석 시스템입니다 🧠
⚙️ 어떻게 작동하나요?
모듈 1: 깊이 프로필 (VPOC) 📊
지표는 마지막 200개 바(설정 가능)를 분석하고 30개의 가격 수준에 볼륨을 분배합니다. 다음을 계산합니다:
- 통제점 (PoC): 가장 거래량이 많은 가격 - 매수자와 매도자가 가장 활발했던 시장 합의점 ⚖️
- 델타: 각 수준에서 매수 압력과 매도 압력의 차이 🔄
- 히트맵: 활동 집중도 시각화 🔥
논리: 가격은 대부분의 대기 유동성이 존재하는 PoC 쪽으로 되돌아가는 경향이 있습니다. 가격이 PoC에서 멀리 떨어져 있으면 되돌아올 확률이 높습니다 🔄
모듈 2: 통계적 예측 (몬테카를로) 🎲
확률적 시뮬레이션(기본 1,000회 반복)을 사용하여 미래 가격을 예측합니다:
- 자산의 과거 추세와 연간 변동성을 계산합니다 📉📈
- 정규 분포(기하학적 브라운 운동 모델)를 사용해 무작위 경로를 생성합니다 🌊
- 표준 편차 밴드(±1 시그마)를 사용해 기대값을 추정합니다 📏
적용 공식: - 바당 드리프트 = 연간 수익률 / 거래일 수 🧮
- 바당 변동성 = 연간 변동성 / √일 수 ⚡
- 예측 = 현재 가격 × e^(총 드리프트 + 정규 무작위 × 총 변동성) 🔢
모듈 3: 시너지 🔗
두 분석을 결합하여 상황별 신호를 생성합니다:
표
신호 조건 의미
강세 ↑ 🟢 가격 > PoC + 긍정적 예측 볼륨으로 확인된 강세 추세
약세 ↓ 🔴 가격 < PoC + 부정적 예측 볼륨으로 확인된 약세 추세
기회 ★ 💡 가격 < PoC + 긍정적 예측 볼륨 지지에서의 반등 가능성
발산 ⚠️ ⚠️ 가격 > PoC + 부정적 예측 반전 가능성 경고
📈 용도는 무엇인가요?
✅ 주요 볼륨 수준 식별 - PoC는 가격 자석 역할을 합니다 🧲
✅ 성공 확률 추정 - 시뮬레이션 내 승리 시나리오 비율 🏆
✅ 위험/보상 평가 - 예상 샤프 비율 및 표준 편차 📊
✅ 거래 방향 확인 - PoC 대비 포지션과 통계적 모멘텀 간 시너지 🎯
✅ 목표 예측 - 정의된 보유 기간 동안의 예상 가격 수준 🎯
🎮 설정 및 사용법
주요 매개변수:
표
그룹 매개변수 기본값 설명
깊이 프로필 분석 기간 200 바 볼륨 프로필 계산을 위한 이력
가격 수준 30 프로필 해상도 (수준이 많을수록 세부 정보 증가) 🔍
수평 오프셋 5 차트상의 프로필 위치 📏
통계적 예측 최대 작동 기간 252 바 예측의 시간 범위 ⏱️
투자 자본 $1,000 금전 계산의 기준 💰
시뮬레이션 1,000 무작위 경로 수 (많을수록 정확하지만 느림) 🔄
무위험 이자율 5% 샤프 비율 계산용 📉
과거 전략 TP/SL 사용 안 함 고정 목표로 시뮬레이션 활성화 🎯
결과 해석 방법 표:
plain
복사
기대값 통계
┌──────────────┬─────────┬─────────┬─────────┬────────┐
│ 방법 │ $ 금액│ % 수익│ 승률│ 샤프 │
├──────────────┼─────────┼─────────┼─────────┼────────┤
│ 과거 │ -$19.56 │ -1.96% │ 47.2% │ -1.24 │
│ 시뮬레이션 │ -$54.05 │ -5.40% │ 21.4% │ -4.95 │
└──────────────┴─────────┴─────────┴─────────┴────────┘
- 과거: 유사한 과거 거래의 평균 성과 📜
- 시뮬레이션: 1,000회 몬테카를로 시뮬레이션의 평균 결과 🎲
- 승률: 긍정적 결과 시나리오의 비율 ✅
- 샤프: 위험 조정 수익률 (1 이상은 좋음, 음수는 나쁨) 📈
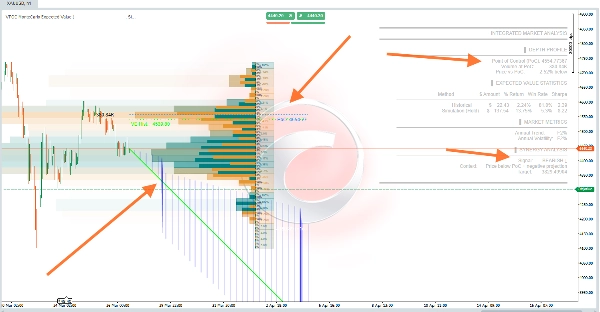
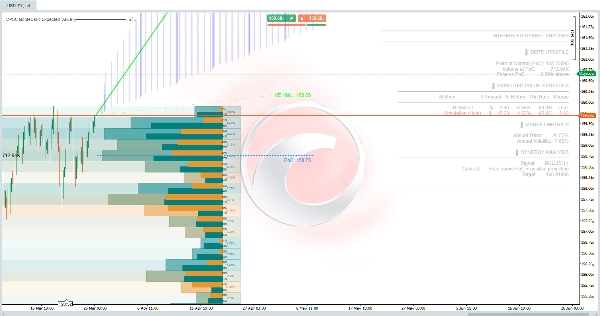
🖼️ 차트의 시각적 요소
표
요소 색상 의미
볼륨 프로필 주황/파랑 그라데이션 가격 수준별 활동 집중도 🎨
PoC 선 파란 점선 미래로 투영된 통제점 🔵
EV 예측선 녹색/마젠타 예상 가격 경로 🟢🔴
±1σ 밴드 흰색 점선 68% 신뢰 구간 📊
과거 EV 선 녹색 점선 과거 데이터를 기반으로 한 기대값 🟢
예측 구역 반투명 파란색 채움 밴드 사이의 확률 영역 🔵
⚠️ 중요 - 한계점
- 매수/매도 신호 아님 - 확률적 분석 도구입니다 🛠️
- 몬테카를로 시뮬레이션은 과거 분포가 유지된다고 가정 (블랙스완 이벤트 예측 불가) 🦢❌
- PoC는 동적임 - 새로운 바마다 재계산 🔄
- 충분한 이력 필요 - 신뢰할 수 있는 예측을 위해 최소 252 바 📊
- 암호화폐 - 전통 시장 252일 대비 365일 연간 거래일에 자동 조정 🪙
💡 권장 사용 전략
- 기회 ★ 💡 찾기 - 가격이 PoC 아래이지만 긍정적 예측 (저평가 가능성)
- 승률 > 50%로 확인 - 성공 확률이 더 높음 ✅
- 발산 ⚠️ ⚠️ 피하기 - 실제 볼륨 대비 과대평가된 가격
- PoC를 기준으로 사용 - 이 유동성 수준 주변에 스톱 또는 목표 설정 🎯
- 과거와 시뮬레이션 비교 - 크게 다르면 시장 체제가 변하는 중 🔄