
VegaXLR - Candlestick Patterns Pro
Gösterge
7 satın almalar
Sürüm 1.0, Mar 2025
Windows, Mac
5.0
Değerlendirmeler: 3
Açıklama
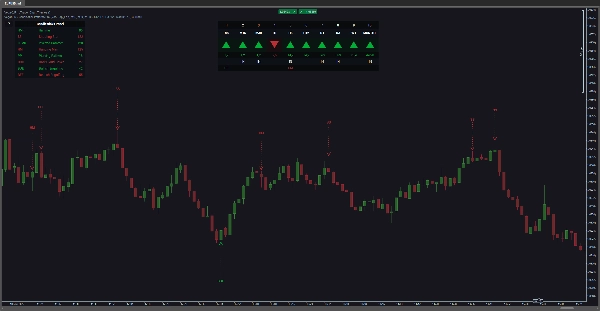
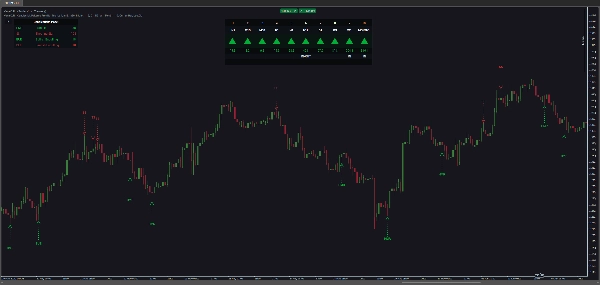
cTrader Candlestick Patterns Pro gelişmiş bir ticaret göstergesidir ve birden çok zaman diliminde 34 mum çubuğu desenini tanımlamak için tasarlanmıştır. Tüccarlara net ve düzenli bir görüntü sunarak, hızlı ve verimli kararlar almalarına yardımcı olur.
Ticaret Zorluklarını Kolayca Çözün
Bu araç, şu amaçla olan tüccarlar için mükemmeldir:
- Boğa ve ayı mum çubuğu desenlerini zahmetsizce tespit etmek.
- Birden çok zaman diliminde piyasa trendlerini gerçek zamanlı izlemek.
- Harekete geçirici ticaret fırsatları için anında uyarılar almak.
- Belirli desenlere veya olaylara dayalı olarak pozisyon yönetimini ve cBot işlemlerini otomatikleştirmek.
Ana Özellikler
- Kapsamlı Desen Tespiti: Doji, Engulfing, Morning/Evening Stars ve daha fazlası dahil olmak üzere 34 mum çubuğu desenini tanımlar.
- Çoklu Zaman Dilimi Analizi: Daha geniş bir piyasa perspektifi için aynı anda 10 zaman dilimine kadar takip eder.
- Gelişmiş Uyarı Sistemi: Önemli desenler ve piyasa olayları için ses, açılır pencere, Telegram veya e-posta yoluyla bildirim alın.
- Pozisyon Yönetimi Otomasyonu: Belirli uyarılara dayalı olarak pozisyonları otomatik kapatır veya cBotları kontrol eder.
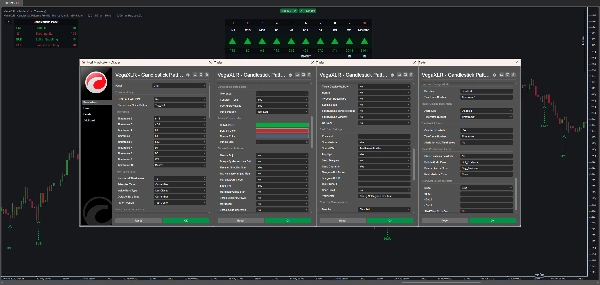
- Özelleştirilebilir Arayüz: Panel renklerini, boyutlarını ve konumlarını tercihinize göre ayarlayın.
- Kullanıcı Dostu Ayarlar: Kişiselleştirilmiş içgörüler için trend dikkate almalarını, tolerans seviyelerini ve desen kısaltmalarını yapılandırın.
Son Güncellemeler
- Sürüm 1.1: Çift yönlü değişim uyarıları eklendi ve küçük cTrader açılır pencere sorunları giderildi.
- Sürüm 1.2: Telegram uyarıları geliştirildi, grafik çekimi uyarıları için Imgur entegrasyonu eklendi ve grafik üzerinde kullanıcı kılavuzu düğmesi dahil edildi.
Desteklenen Uyarı Türleri
- Birden çok zaman diliminde mum çubuğu desenleri için uyarılar.
- Piyasa yönü değişiklikleri için bildirimler.
- İç ve dış bar oluşumları için uyarılar.
Tespit Edilebilir Desenler
34 desenden bazıları şunlardır:
- Doji çeşitleri (Dört Fiyat, Standart, Uzun Bacaklı, Yusufçuk, Mezar Taşı)
- Çekiç, Yıldız Atışı, Ters Çekiç, Asılı Adam
- Engulfing desenleri (Boğa ve Ayı)
- Sabah/Akşam Yıldızları, Üç Beyaz Asker, Üç Kara Karga
- Harami (Boğa ve Ayı), Maşa Tepesi/Tabanı
- Dönen Üst, Yükselen/Düşen Üç Yöntem ve daha fazlası.
Ticaret sürecinizi basitleştirin, piyasa hareketlerinin önünde kalın ve cTrader Candlestick Patterns Pro göstergesi ile daha akıllı kararlar verin.
Özet
YZ özeti
VegaXLR - Candlestick Patterns Pro is an advanced trading indicator for the cTrader platform that identifies 34 distinct candlestick patterns across multiple timeframes. It supports real-time monitoring of up to 10 timeframes simultaneously, providing a comprehensive market perspective. The indicator features an organized display to help traders quickly recognize bullish and bearish patterns such as Doji variations, Engulfing, Morning/Evening Stars, Hammer, Shooting Star, Harami, and more.
Key functionalities include an advanced alert system that notifies users via sound, pop-up, Telegram, or email about important patterns and market events. It also enables automation of position management and cBot operations based on specific alerts. The interface is customizable, allowing adjustment of panel colors, sizes, and positions, while user-friendly settings let traders configure trend considerations, tolerance levels, and pattern abbreviations for tailored insights.
Supported alert types cover candlestick patterns, market direction changes, and inside/outside bar formations. Recent updates have enhanced alert capabilities and integrated chartshot alerts via Imgur, along with a user guide accessible directly on the chart. This tool is designed to assist traders in simplifying their analysis, staying ahead of market movements, and making informed trading decisions efficiently.
Gösterge profili
Müşteri değerlendirmeleri
5.0
Değerlendirmeler: 3
5 | 100 % | |
4 | 0 % | |
3 | 0 % | |
2 | 0 % | |
1 | 0 % |
Müşteri değerlendirmeleri
March 14, 2025
Clean trade assistant if the trader wants it makes common setups easier to notice. It works best as support, not a final decision maker. I would only count patterns with 2 confirmations, a 1R stop plan and at least 20 candles of context. patterns still need trend and context.
March 13, 2025
March 13, 2025
Practical demo helper for traders who use visual price action. It gives value around pattern detection, but patterns still need trend and context. A fair sample is 30 pattern signals filtered by trend, not every candle that looks clean. The pattern is helpful when it supports the plan, not when it becomes the plan.
Tartışma
SSS
Forex
cTrader Store üzerinden erişilebilen işlem botları, göstergeler ve eklentiler gibi ürünler, üçüncü taraf sağlayıcılar tarafından sağlanır ve yalnızca bilgilendirme ve teknik erişim amaçlarıyla sunulur. cTrader Store bir broker değildir ve yatırım tavsiyesi, kişisel öneriler vermez veya gelecekteki performansı garanti etmez.


!["[Hamster-Coder] Pivot Points MTF" logosu](https://cdn.ctrader.com/image/webp/4c143e5a-309c-40e3-a578-f04d1e133ffa_31159)


Fiyat
231
Satışlar
690
Ücretsiz yüklemeler