Opis
DETEKTOR SWINGÓW
Strukturalne punkty zwrotne + zniesienia Fibonacciego + RSI
--------------------------------------------------
DARMOWY WSKAŹNIK
Identyfikuj strukturalne swingi. Zobacz trend. Handluj z konfluencją.
--------------------------------------------------
CO ROBI TEN WSKAŹNIK
Detektor Swingów identyfikuje strukturalne maksima i minima swingów, wykorzystując wykrywanie lokalnych ekstremów z konfigurowalną głębokością i automatycznym filtrowaniem odchylenia.
Następnie łączy swingi liniami trendu, nakłada standardowe poziomy zniesienia Fibonacciego i wyświetla aktualną wartość RSI obok ceny.
--------------------------------------------------
KLUCZOWE CECHY
- Wykrywanie punktów swingów (konfigurowalna głębokość)
- AUTO-ODCHYLENIE: filtrowanie oparte na ATR dostosowuje się do dowolnego interwału czasowego
- Tryb stałego odchylenia w pipach (do ręcznej kontroli)
- Linie trendu swingów (wzrost niebieski, spadek pomarańczowy)
- ZNIESIENIE FIBONACCIEGO (0, 23.6, 38.2, 50, 61.8, 78.6, 100 procent)
- NAKŁADKA WARTOŚCI RSI (aktualne RSI obok ceny)
- Kolory do personalizacji
- Optymalizacja wydajności (maksymalna liczba słupków do rysowania)
--------------------------------------------------
AUTO-ODCHYLENIE - KLUCZOWA CECHA
Dostępne dwa tryby odchylenia:
- STAŁE PIPY: Ustaw stałą minimalną odległość w pipach między swingami
- Oparte na ATR (AUTO): Dynamiczne odchylenie oparte na bieżącej zmienności
DLACZEGO AUTO-ODCHYLENIE JEST WAŻNE:
- M1 do M5: Ścisłe odchylenie (wychwytuje małe swingi)
- H1 do H4: Średnie odchylenie (wychwytuje strukturę)
- D1 do MN1: Szerokie odchylenie (wychwytuje główne swingi)
Wskaźnik automatycznie dostosowuje się do używanego interwału czasowego. Nie jest potrzebna ręczna regulacja przy zmianie wykresów.
Dzięki temu Detektor Swingów jest użyteczny na WSZYSTKICH interwałach — od wykresów minutowych po miesięczne.
--------------------------------------------------
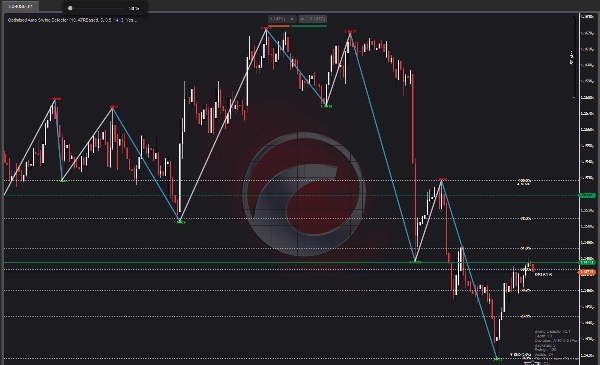
ZNIESIENIE FIBONACCIEGO - KLUCZOWA CECHA
Dla ostatniego zakończonego swingu wskaźnik rysuje:
- 0,0 procent (początek swingu)
- 23,6 procent
- 38,2 procent
- 50,0 procent
- 61,8 procent
- 78,6 procent
- 100,0 procent (koniec swingu)
Przełączaj linie i etykiety włącz/wyłącz. Wszystkie poziomy są kodowane kolorami dla szybkiej wizualnej orientacji.
--------------------------------------------------
NAKŁADKA RSI - KLUCZOWA CECHA
Aktualna wartość RSI jest wyświetlana obok ceny z kodowaniem kolorów:
- CZERWONY: RSI powyżej 70 (przekupienie)
- ZIELONY: RSI poniżej 30 (przesprzedanie)
- BIAŁY: RSI między 30 a 70 (neutralny)
Zapewnia natychmiastowy kontekst momentum bez otwierania osobnego okna RSI.
--------------------------------------------------
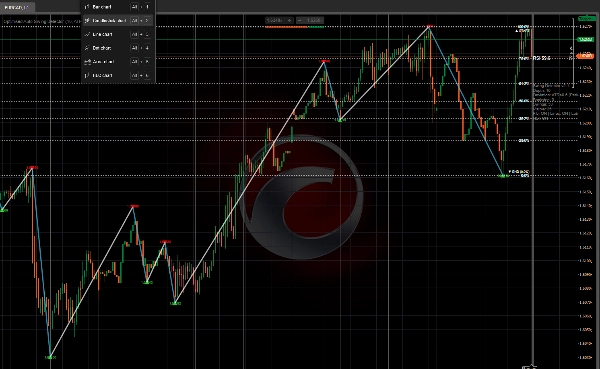
ELEMENTY WIZUALNE
- Czerwone strzałki w dół = maksima swingów
- Zielone strzałki w górę = minima swingów
- Niebieskie linie = wzrost (od dołka do szczytu)
- Pomarańczowe linie = spadek (od szczytu do dołka)
- Złote linie poziome = poziomy Fibonacciego
- Białe etykiety = procenty Fibonacciego
- Wartość RSI = aktualne RSI obok ceny
- Panel informacyjny = głębokość, odchylenie, backstep, liczba swingów
--------------------------------------------------
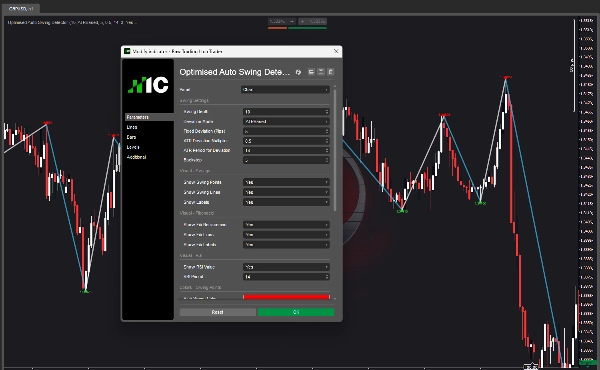
PRZEGLĄD PARAMETRÓW
USTAWIENIA SWINGÓW:
- Głębokość Swingu: ile słupków sprawdzać pod kątem lokalnych ekstremów
- Tryb odchylenia: Stałe Pipy lub oparte na ATR (Auto)
- Stałe odchylenie: minimalna odległość w pipach między swingami
- Mnożnik odchylenia ATR: mnożnik dla odchylenia opartego na ATR
- Okres ATR: okres do obliczania ATR
- Backstep: minimalna liczba słupków między swingami
WIZUALIZACJA - SWINGI:
- Pokaż punkty swingów: przełącz strzałki
- Pokaż linie swingów: przełącz linie trendu
- Pokaż etykiety: przełącz etykiety cen
WIZUALIZACJA - FIBONACCI:
- Pokaż zniesienia Fib: przełącz nakładkę Fibonacciego
- Pokaż linie Fib: przełącz linie poziome
- Pokaż etykiety Fib: przełącz etykiety procentowe
WIZUALIZACJA - RSI:
- Pokaż wartość RSI: przełącz nakładkę RSI
- Okres RSI: okres do obliczania RSI
KOLORY:
- Kolor wysokiego swing
- Kolor niskiego swing
- Kolor linii wzrostu
- Kolor linii spadku
- Kolor linii Fib
- Kolor tekstu Fib
- Kolor etykiety RSI
WYDAJNOŚĆ:
- Maksymalna liczba słupków do rysowania: ogranicza rysowanie dla szybszej wydajności
--------------------------------------------------
ZASTOSOWANIA
- Identyfikuj strukturalne punkty swingów na DOWOLNYM interwale czasowym
- Rysuj linie trendu między swingami
- Używaj poziomów Fibonacciego do wejść, wyjść i celów zysku
- Potwierdzaj transakcje konfluencją RSI
- Zrozum strukturę rynku na pierwszy rzut oka
- Zmieniaj interwały bez dostosowywania parametrów (Auto-Odchylenie)
--------------------------------------------------
UŻYTECZNOŚĆ INTERWAŁÓW
Z włączonym AUTO-ODCHYLENIEM wskaźnik działa na:
- M1, M5, M15 (skalpowanie)
- M30, H1, H4 (day trading)
- D1 (swing trading)
- W1, MN1 (pozycjonowanie)
Jeden wskaźnik. Wszystkie interwały.
--------------------------------------------------
AKTUALIZACJA DO STRUCTURAL HEAT ZONES
Ten darmowy wskaźnik pokazuje swingi i strukturę.
Structural Heat Zones idzie dalej — mapuje intensywność uczestnictwa, akceptację vs odrzucenie oraz zaangażowanie rynku w wielu strefach.
Szukaj Structural Heat Zones w sklepie cTrader.
--------------------------------------------------
AKTUALIZACJA DO INVICTUS EA
Invictus EA wykorzystuje tę samą technologię strukturalną do wykonywania automatycznych transakcji.
Szukaj Invictus w sklepie cTrader.
--------------------------------------------------
NOTATKI TECHNICZNE
- Nakładka wskaźnika
- Działa na dowolnym interwale i symbolu
- Brak przemalowywania (swingi są historyczne)
- Optymalizacja pod kątem wydajności
--------------------------------------------------
WSPARCIE
Dożywotnie aktualizacje w cenie.
DLA WIĘCEJ INFORMACJI - Kliknij profil dewelopera poniżej.
Podsumowanie
Opinie klientów
5 | 100 % | |
4 | 0 % | |
3 | 0 % | |
2 | 0 % | |
1 | 0 % |