Wskaźnik
RSI
Breakout
XAUUSD
ATR
Commodities
Supertrend
Crypto
BTCUSD
Prime Trend Targets
Logo „Prime Trend Targets”
03/09/2025
89
Desktop
Since 03/10/2024
Sprzedaż
102
Free installs
14946
Przesłany obraz „Prime Trend Targets”Przesłany obraz „Prime Trend Targets”Przesłany obraz „Prime Trend Targets”Przesłany obraz „Prime Trend Targets”Przesłany obraz „Prime Trend Targets”Przesłany obraz „Prime Trend Targets”

Description

Pinescriptlabs Store indicators:                        🤖 Pinescriptlabs  Store cBots : (cBot)
Gold & BTC BreakoutSession Pivots(new)

Auto-Trend Channel

PREMIUM SSL CHANNEL

ZigZag

 ICT Power of 3 
                                                   

SmartTrend Support &
Resistance
Lines
       

Fair Value Gap Sessions                
       

 BOS & CHOCH

RSI Trend Trigger

Channel Breakout System

Supertrend

Market Imbalance

Adaptive Trend Channel 

Dynamic
Market Structure
Analysis
of
Turning Points

Order Block

Fibonacci
Linear
Regression
Multi-timeframe

Volume POC Heatmap

Dynamic RSI

Momentum Fair Value Gap

Market Flow Projection

Dynamic Trend Gradient

Multi-Level
Candle Bias
Tracker

Zig-Zag Extremity Tracker

Reactive Moving Average

Auto
Support and
Resistance
Trend
Lines

All
Support and
Resistance
Levels

Leverage Liquidation Map

Zones Supply Demand

Dynamic Range Momentum


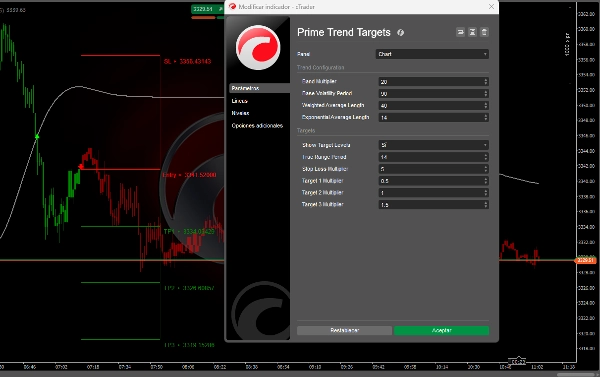
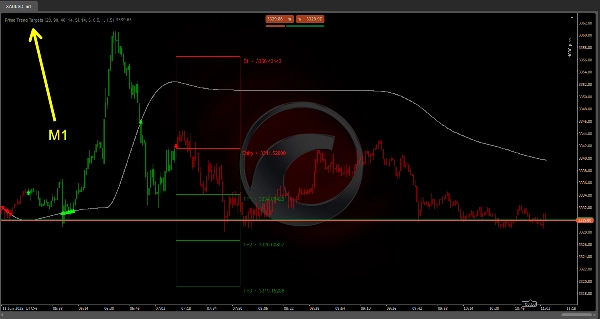
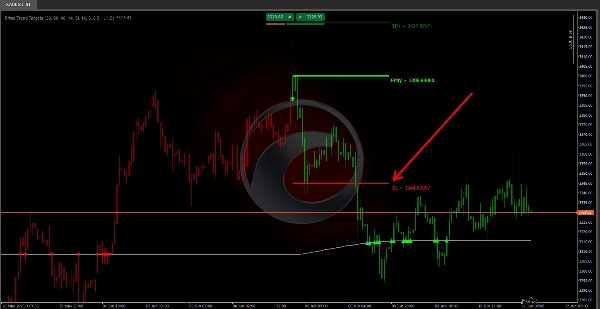
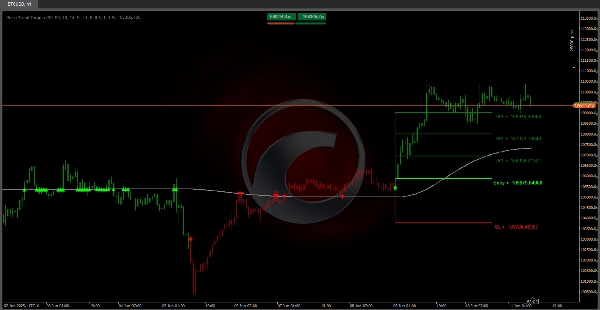
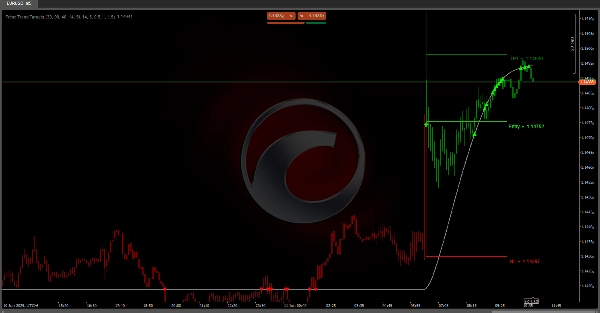
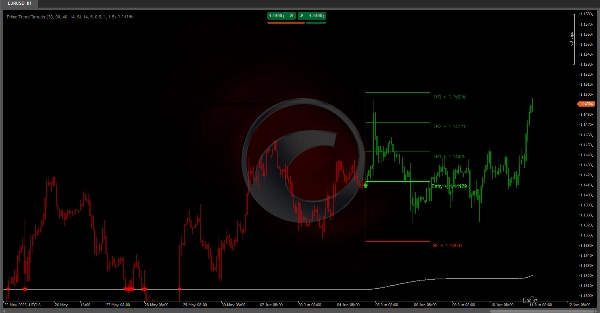
Prime Trend Targets :

offers a smoothed trendline based on volatility bands (ATR) with persistence logic, filtering out minor noise. 🔄 It detects trend reversals by comparing the current value of the line with the previous one and validates signals through a rejection count when price repeatedly tests the line. ✅ Once a phase shift is confirmed, it projects entry, stop loss, and up to three volatility-adjusted targets (ATR × multipliers), drawing risk/reward levels and zones on the chart. 🎨 Candles are colored by phase for easy reading.

⚙️ Parameter Impact

• Higher sensitivity vs. robustness:

  • 📉 Shorter ATR & smoothing periods react faster to reversals but generate more noise.
  • 📊 Longer periods smooth out false signals but may delay detection.
  • 🔍 Larger multipliers widen bands & stops, reducing premature signals but increasing lag or losses if the expected reversal fails.
  • 🎯 Smaller targets lock in moderate gains quickly; larger targets aim for extended moves but with lower hit probability.

• Holistic tuning: Combine volatility, band, smoothing, and level management settings for your asset & timeframe.

Operational Guidelines


•  Backtest & demo-test thoroughly—try different combos under varied conditions (trending, ranging, high/low volatility).
•  Combine with other analysis: Support/resistance, candlestick patterns, volume, or confirming indicators.
•  Risk management: Size positions based on stop distance to maintain a fixed risk percentage.
•  Discipline & periodic review: Avoid over-optimizing for past data; adjust when market conditions shift.

Więcej od tego autora
Najwyżej oceniane
Za darmo
Wskaźnik
RSI
Breakout
XAUUSD
+6
ZigZag
ZigZag filters noise, spots trends, patterns, pivots, aiding analysis, trade management, and confirmations. 📉📈
Wskaźnik
RSI
Breakout
XAUUSD
+6
Order Block
Identify bullish and bearish Order Blocks to spot key support/resistance levels and potential trend reversals! 📈🔄
Wskaźnik
RSI
Breakout
XAUUSD
+5
Auto-Trend Channel
Adaptive trend channel using linear regression and Pearson correlation for dynamic support, resistance, and trends.
Wskaźnik
RSI
XAUUSD
Breakout
+5
BOS & CHOCH
Market structural patterns , specifically the concepts of Change of Character (ChoCH) 🔄 and Break of Structure (BoS) 💥
Wskaźnik
RSI
Breakout
XAUUSD
+5
Zones Supply Demand
📊Zones Supply & Demand: Identifies key price levels with high volume concentration, marking Supply/Demand Zones & Marke
Wskaźnik
RSI
Breakout
XAUUSD
+5
Supertrend
💹 Define a price channel 📈 and determine trend direction (bullish 🟢 or bearish 🔴).
Wskaźnik
RSI
Breakout
XAUUSD
+6
Volume POC Heatmap
📊 Shows volume by price levels, highlights POC, and key zones. Identifies dynamic support/resistance and imbalances.
Wskaźnik
RSI
Breakout
Supertrend
All Support and Resistance Levels
"Identify key market zones and visualize support/resistance from multiple timeframes on a single chart.
Wskaźnik
RSI
Breakout
XAUUSD
+6
Fair Value Gap Sessions
identify and highlight temporary market inefficiencies known as "fair value gaps" 🚨 within specific trading Sessions.
Wskaźnik
RSI
Breakout
XAUUSD
+4
Dynamic Market Structure Analysis of Turning Points
Identify market structure effortlessly with swing highs, lows, CHoCH, and BOS levels for smart trading decisions! 📊🔍"
Wskaźnik
Indices
RSI
XAUUSD
+7
RSI Divergence
Detects bullish and bearish divergences
Wskaźnik
RSI
Breakout
Supertrend
Trend Heikin Multi MA
🚀 TrendHeikinMultiMA: Advanced trend detection using Heikin-Ashi smoothing & MAs! Eliminates noise, confirms real trend
Wskaźnik
RSI
Breakout
XAUUSD
+4
Multi-Level Candle Bias Tracker
Price direction by calculating the probability of reaching new highs/lows. Shows levels & stats📈
Wskaźnik
RSI
Breakout
Supertrend
Leverage Liquidation Map
📊 Liquidation Map: Potential areas where highly leveraged investors might face liquidations.
Wskaźnik
RSI
Breakout
Supertrend
Market Trend OB
Price action to detect when the market changes trend (MSB) and defines, order blocks , ZigZag etc.📊
Advanced Market Structure Bos,Choch,SwinLevels, Order Blog
Advanced price action tool that combines multiple technical analysis concepts
Wskaźnik
RSI
Breakout
Supertrend
+3
Fibonacci Linear Regression Multi-timeframe
Combining Fibonacci levels and regression to analyze multidimensional market trends across multiple timeframes¡
Wskaźnik
RSI
Breakout
Supertrend
Zig-Zag Extremity Tracker
Dynamically adjusts regression channels based on ZigZag extremes, resetting when price breaks bands to track real trends
Możesz także polubić
Wskaźnik
Stocks
Forex
Crypto
Quantum Weighted Moving Average (QWMA)
Quantum Weighted Moving Average (QWMA): an advanced moving average that dynamically adjusts weights to market movement
Wskaźnik
Indices
Breakout
XAUUSD
+3
AnchoredVWAP
A precision overlay tool that combines session-aware VWAP logic and standard deviations.
Wskaźnik
Grid
Martingale
Signal
+2
Trend Pulse X
is a trend-following indicator designed to provide a clear view of market direction, momentum, and strength
IR Moving MTF
multi time frame moving averge. you could choose different type of price like median ,high and ... and differnt type of
Wskaźnik
Breakout
Commodities
Forex
+3
MAGIC BLOCK STRATEGY
Block Liquidity,indicator.Block Order, Liquids Stops, Signal Sentiment,signal correction
Najwyżej oceniane
Za darmo
IR Macd + MacdLine
some user add moving average to macd to see better. in ctrader 4.3.11 there is a problem with this . I make a macd tha
Wskaźnik
RSI
XAUUSD
ATR
+3
RSI NextGen
The RSI NextGen is an advanced and modernized version of the classic Relative Strength Index (RSI)
Wskaźnik
RSI
Breakout
XAUUSD
+5
Trailing Smart Algorithm
Trailing algo 📈 auto-tracks trends 🎯 adapts to volatility 🌟 precise moves 🛡️ retest signals 🚀 no lag, smart market
Buy and sell indicator
Buy and Sell Signals
Wskaźnik
Signal
MACD
TradingViewMACD
Enhance your trading strategy with our customizable TradingViewMACD indicator. Optimize and elevate your market analysis
Wskaźnik
Grid
NAS100
RSI
+16
Smart Money Breakout Channels
Smart Money Breakout Channels – Auto-detect breakout zones with price, volume & volatility insights on cTrader.
Wskaźnik
Stocks
Commodities
Forex
buy sell
SmartSignal Pro: Precise BUY/SELL signals to profit in any market. Trade like a pro! 🚀
FVG
The Indicator is a powerful tool for price-action traders seeking to identify and exploit short-term imbalances.
Najwyżej oceniane
Logo „STC”
5.0
(2)
Za darmo
STC
Schaff Trend Cycle (STC) Indicator
Wskaźnik
NAS100
Indices
NZDUSD
+9
RT True Strength Index
Enhance trading with TSI! Use the True Strength Index for clear insights into market momentum and trend strength.
DMG Indicator POSIZIONE APERTE e Prezzi ,SU GRAFICO
Visualizzazione delle Posizioni dei simboli attivi su grafico
VegaXLR - Chart Patterns Alerts
Enhance your trading strategy with automated detection and alerts for key chart patterns.
Wskaźnik
NAS100
NZDUSD
XAUUSD
+13
RT MACD Histogram
Enhance MACD Histogram! Visualize bull and bear price changes with vibrant colors for clearer, more insightful trading.