
VegaXLR - Fibonacci Bands
مؤشر
2 عمليات الشراء
الإصدار 1.0، Feb 2025
Windows, Mac
5.0
التقييمات: 2
الوصف
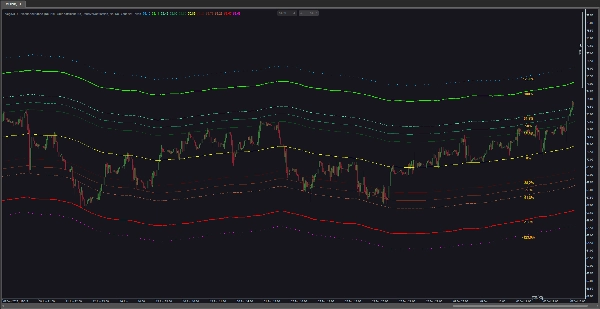
إذا كنت تبحث عن مؤشر قناة فيبوناتشي ديناميكي لـ cTrader، فلا داعي للبحث أكثر. يقوم هذا المؤشر برسم أشرطة فيبوناتشي تلقائيًا بالتوازي مع المتوسط المتحرك الذي تختاره. إنه سهل الاستخدام، ومثل مؤشرات الأخرى، يوفر تنبيهات عبر النوافذ المنبثقة، والصوت، والبريد الإلكتروني، ورسائل تيليجرام. بالإضافة إلى ذلك، لديك المرونة لتخصيص الأشرطة، ومستويات فيبوناتشي، والتنبيهات.
إليك قائمة ميزاته:
- حساب أشرطة فيبوناتشي: يقوم المؤشر بحساب ورسم أشرطة فيبوناتشي بناءً على المتوسط المتحرك الذي تختاره. تنبع هذه الأشرطة من مستويات فيبوناتشي (مثل 0.0٪، 38.2٪، 61.8٪، أو غيرها) وتمتد فوق وتحت المتوسط المتحرك بعامل محدد.
- تكوين المتوسط المتحرك: قم بتخصيص نوع المتوسط المتحرك (مثل البسيط، الأسي، إلخ) وعدد الفترات المستخدمة في الحساب. يعمل المتوسط المتحرك كأساس لأشرطة فيبوناتشي.
- وظيفة التنبيه: يوفر المؤشر خيارات تنبيه متنوعة لإخطار المتداولين بالأحداث المحددة. يشمل ذلك تنبيهات لمس مستوى السعر وتنبيهات القرب.
- تنبيهات لمس مستوى السعر: قم بتكوين المؤشر لإطلاق التنبيهات عندما يلمس السعر مستويات فيبوناتشي محددة. يمكن أن تستند التنبيهات إلى سعر الإغلاق أو فور لمس السعر للمستوى.
- تنبيهات القرب: قم بإعداد تنبيهات القرب لتلقي إشعارات عندما يقترب السعر أو يبتعد عن مستوى فيبوناتشي محدد ضمن مسافة معينة. يمكن أن تُطلق التنبيهات عندما يقترب السعر أو يبتعد عن المستوى.
- خيارات إخراج التنبيه: اختر من بين تنبيهات صوتية، نوافذ منبثقة، رسائل تيليجرام، وإشعارات البريد الإلكتروني للتنبيهات. يمكن تخصيص التنبيهات الصوتية باختيار ملفات صوتية مختلفة.
- خيارات التمثيل البصري: قم بتخصيص تمثيل مستويات فيبوناتشي مع خيارات مثل عرض القيم المئوية، تعيين لون لملصقات النسبة المئوية، التحكم في موقع الملصق على الرسم البياني، تمكين/تعطيل أشرطة معينة، واختيار اللون، السماكة، والمظهر للأشرطة.
- مستويات فيبوناتشي قابلة للتكوين: قم بتخصيص المؤشر وفقًا لاستراتيجيتك التداولية عن طريق تعديل مستويات فيبوناتشي المحددة المستخدمة في الحساب. يمكن تخصيص المستويات الإيجابية والسلبية بشكل فردي.
- دليل المستخدم المدمج: يمكنك الوصول إلى دليل المستخدم لهذا المؤشر مباشرة من الرسم البياني.
باختصار، يجمع مؤشر VegaXLR - أشرطة فيبوناتشي بين تحليل فيبوناتشي والمتوسطات المتحركة لمساعدتك في تحديد مستويات الدعم والمقاومة المحتملة. مع وظيفة التنبيه القابلة للتكوين وخيارات التمثيل البصري، يعد أداة لا تقدر بثمن للمتداولين الذين يعتمدون على تصحيحات أو توسعات فيبوناتشي.
الملخص
ملخص الذكاء الاصطناعي
VegaXLR - Fibonacci Bands is a dynamic indicator for cTrader that automatically plots customizable Fibonacci bands parallel to a user-selected moving average. Traders can configure the moving average type (e.g., Simple, Exponential) and periods, which serve as the basis for the Fibonacci bands derived from adjustable Fibonacci levels (such as 0.0%, 38.2%, 61.8%, and others). The indicator supports both positive and negative Fibonacci levels, allowing tailored analysis.
It features multiple alert options including price level touch alerts—triggered on price contact or close at specified Fibonacci levels—and proximity alerts that notify when price approaches or moves away from these levels within a defined range. Alerts can be delivered via pop-up, sound (with customizable sounds), email, and Telegram messages.
Visualization settings enable customization of band colors, thickness, label display and position, and selective enabling or disabling of bands. A built-in user guide is accessible directly from the chart for ease of use.
Overall, VegaXLR - Fibonacci Bands combines Fibonacci retracement and expansion analysis with moving averages to assist traders in identifying potential support and resistance zones, enhanced by configurable alerts and visualization options.
ملف تعريف المؤشر
تقييمات العملاء
5.0
التقييمات: 2
5 | 100 % | |
4 | 0 % | |
3 | 0 % | |
2 | 0 % | |
1 | 0 % |
تقييمات العملاء
February 23, 2025
the setup gets a moment before execution, but a real person still needs review the setup.
February 19, 2025
مناقشة
الأسئلة الشائعة
Forex
يتم توفير المنتجات المتاحة من خلال cTrader Store، بما في ذلك روبوتات التداول والمؤشرات والإضافات، من قبل مطوري الطرف الثالث وإتاحتها لأغراض الوصول المعلوماتي والفني فقط. cTrader Store ليس وسيطًا ولا يقدم نصائح استثمارية أو توصيات شخصية أو أي ضمان للأداء المستقبلي.


السعر
232
المبيعات
695
التثبيتات المجانية