calculateSpreads_withSourceCode
Indicador
204 transferências
Versão 1.0, Mar 2025
Windows, Mac
5.0
Avaliações: 1

Descrição
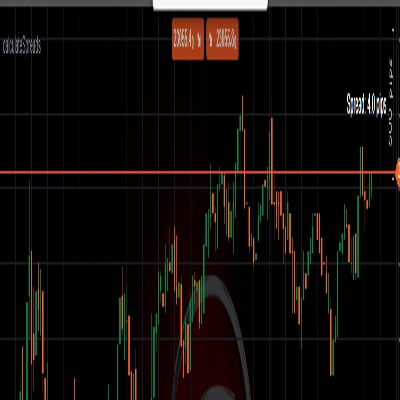
O indicador calcula o spread em pips
Resumo
Resumo de IA
This indicator calculates the spread in pips for trading instruments. It provides a numerical measure of the difference between bid and ask prices, expressed in pips, which is a standard unit in forex and other markets. The product includes source code, allowing users to review or modify the calculation logic. It is designed for integration within trading platforms to assist traders in monitoring spread values directly on their charts.
Perfil do indicador
Avaliações de clientes
5.0
Avaliações: 1
5 | 100 % | |
4 | 0 % | |
3 | 0 % | |
2 | 0 % | |
1 | 0 % |
Avaliações de clientes
August 18, 2025
Real-time spread monitoring, customizable, open-source for modification. Cons: No history chart, no alerts, limited analytics.
Conversa
Perguntas frequentes
Os produtos disponíveis através da cTrader Store, incluindo bots de negociação, indicadores e plugins, são fornecidos por programadores terceiros e são disponibilizados apenas para fins informativos e de acesso técnico. A cTrader Store não é um corretor e não fornece aconselhamento em matéria de investimento, recomendações pessoais ou qualquer garantia de desempenho no futuro.


Preço
Desde 27/02/2025
204
Instalações gratuitas