
Descrição
Scanner de Tendência Multi Timeframe – Leia a História Completa do Mercado de Relance
Scanner de Tendência Multi Timeframe oferece uma visão limpa e compacta da tendência através de múltiplos timeframes diretamente no seu gráfico cTrader – de M5 até D1 – além de um viés geral claro de negociação:
➡️ Forte COMPRA / COMPRA / NEUTRO / VENDA / Forte VENDA
Em vez de pular entre gráficos e adivinhar, você obtém um mapa estruturado de tendência multi-timeframe em um só lugar.
🧠 Motor Inteligente de Pontuação de Tendência
Para cada timeframe habilitado (M5, M15, M30, H1, H4, D1), o indicador calcula uma pontuação robusta de tendência usando três componentes principais:
- 📈 EMA (direção e inclinação da tendência)
-
- Preço vs EMA (acima/abaixo)
- Inclinação da EMA (subindo/descendo)
- 💪 RSI (momentum)
-
- Normalizado em torno do nível 50
- 🌊 ATR (filtro de volatilidade opcional)
-
- Opcionalmente ignora condições de volatilidade ultra baixa
Cada timeframe recebe uma pontuação na faixa -100 a +100, que é então traduzida em um estado fácil:
- 🟢 ALTA – viés de alta
- 🔴 BAIXA – viés de baixa
- 🟡 NEUTRO – lateral / incerto
Você vê instantaneamente quais timeframes concordam e onde está o verdadeiro viés direcional.
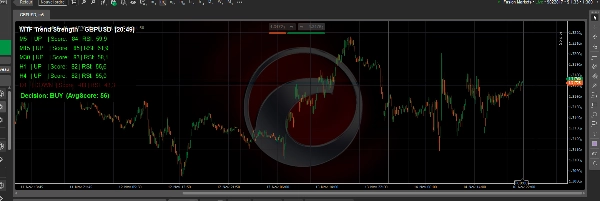
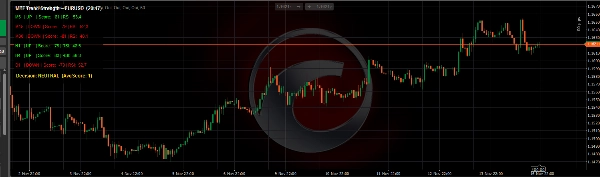
📊 Painel Limpo e Leve no Gráfico
A ferramenta desenha um pequeno painel de interface sobre seu gráfico, projetado para ser legível mas não intrusivo:
- Uma linha por timeframe, por exemplo:
M15 | ALTA | Pontuação: 63 | RSI: 61.2 - Codificado por cores:
-
- Verde para ALTA
- Vermelho para BAIXA
- Dourado para NEUTRO
- O painel pode ser colocado no canto superior esquerdo ou no canto superior direito.
- Painel ajustável:
-
- Cor e opacidade do fundo
- Tamanho da fonte
- Altura da linha
- Cores para viés de alta / baixa / neutro
Perfeito para scalpers, traders diários e swing traders que querem confirmar rapidamente o panorama maior.
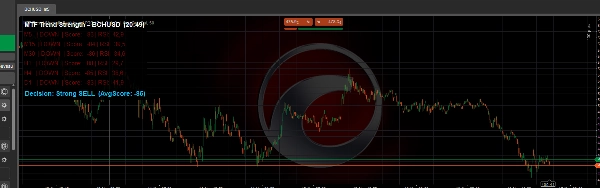
🧭 Linha de Viés Global de Negociação
Na parte inferior do painel, Scanner de Tendência Multi Timeframe calcula a pontuação média de todos os timeframes ativos e a transforma em um viés global claro:
- ✅ Forte COMPRA – forte alinhamento de alta entre os timeframes
- ✅ COMPRA – viés de alta, mas não extremo
- ⚪ NEUTRO – mercado misto ou instável
- ❌ VENDA – viés de baixa
- ❌ Forte VENDA – forte alinhamento de baixa
Isso o torna ideal como um filtro de tendência e direção para:
- Negociação manual (negocie apenas na direção do viés)
- Entradas de scalping com confirmação de timeframe superior
- Swing trading alinhado com H1 / H4 / D1
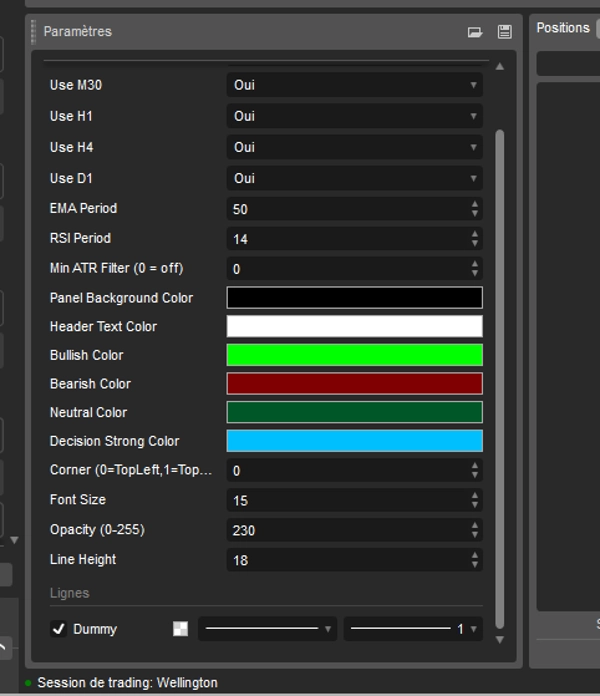
🔧 Totalmente Personalizável
Você mantém controle total sobre a lógica e a aparência:
- Ative/desative cada timeframe (M5, M15, M30, H1, H4, D1)
- Configure:
-
- Período da EMA (sensibilidade da tendência)
- Período do RSI (comportamento do momentum)
- Filtro mínimo do ATR (0 = desligado)
- Configurações visuais:
-
- Cor e transparência do fundo do painel
- Cores do texto do cabeçalho e das linhas
- Cores para viés de alta / baixa / neutro / forte
- Tamanho da fonte e espaçamento entre linhas
O indicador funciona em qualquer símbolo suportado pelo cTrader: forex, índices, ouro, cripto, ações.
Se você quer uma forma clara, objetiva e visual de ler o alinhamento da tendência em múltiplos timeframes e decidir rapidamente se o mercado está mais adequado para comprar, vender ou ficar de fora, Scanner de Tendência Multi Timeframe é uma adição poderosa à sua caixa de ferramentas cTrader.
Resumo
The indicator displays a compact, color-coded dashboard on the chart, showing one line per timeframe with trend status, score, and RSI value. Users can customize the panel’s position, colors, font size, and which timeframes to include. A global trading bias line at the bottom summarizes the average score across timeframes into five bias states: Strong BUY, BUY, NEUTRAL, SELL, and Strong SELL. This feature supports manual trading, scalping, and swing trading by providing clear directional guidance.
Multi Timeframe Trend Scanner works on any cTrader-supported symbol, including forex, indices, commodities, cryptocurrencies, and stocks. It is designed to help traders quickly assess trend alignment and market bias in a single, easy-to-read interface.
Avaliações de clientes
5 | 100 % | |
4 | 0 % | |
3 | 0 % | |
2 | 0 % | |
1 | 0 % |


![Logótipo de "[Hamster-Coder] Pivot Points (Demo)"](https://cdn.ctrader.com/image/webp/87b54299-8c73-4942-9207-4bc6db824811_31153)