
Descrição
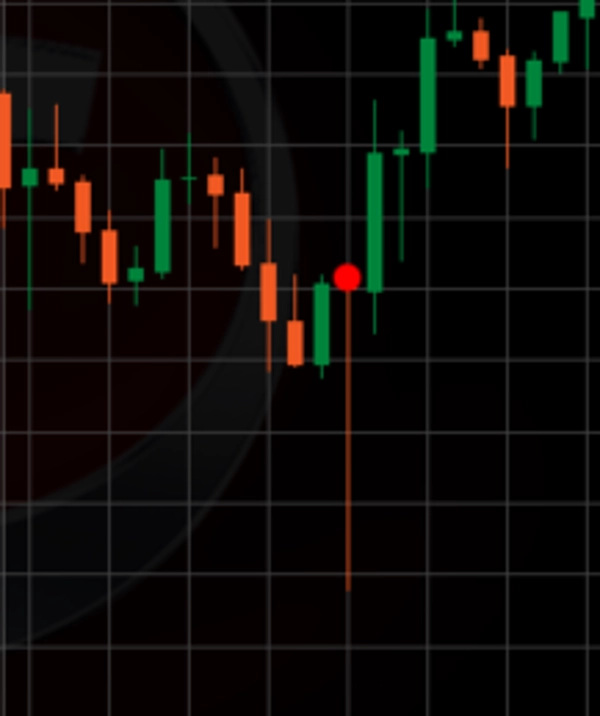
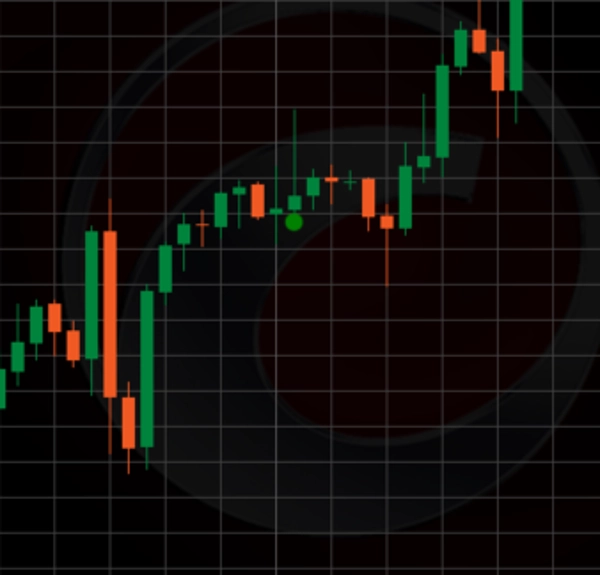
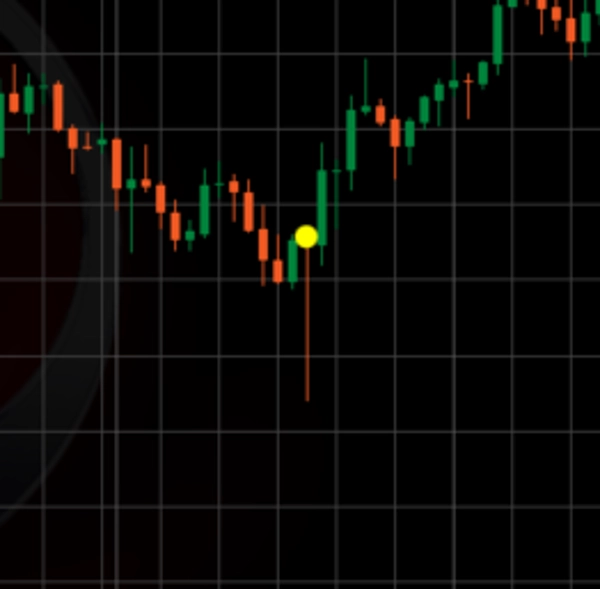
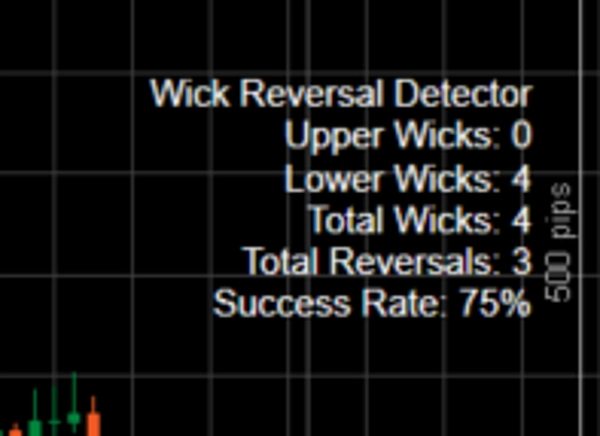
O indicador Long Wick é uma poderosa ferramenta de análise técnica desenvolvida para o cTrader que se concentra em identificar velas com pavios incomumente longos — seja superior ou inferior — em relação ao tamanho do corpo e à faixa média da vela. Ele destaca esses pavios no gráfico como potenciais pontos de reversão, onde o mercado pode ter rejeitado preços mais altos (para pavios superiores, sugerindo uma reversão de baixa) ou preços mais baixos (para pavios inferiores, sugerindo uma reversão de alta). O indicador usa uma combinação de um multiplicador de limite de pavio, uma proporção mínima entre pavio e corpo, e uma Média Móvel Simples (SMA) para filtragem de tendência, para eliminar ruídos e focar em padrões significativos de rejeição de preço. Cada pavio detectado é marcado com um círculo (verde para pavios superiores, vermelho para pavios inferiores se confirmados como reversões, ou amarelo se não), e dados estatísticos (por exemplo, total de pavios, reversões e taxa de sucesso) são exibidos no gráfico para fácil acompanhamento.
Como Usar no Trading:
- Identificação de Oportunidades de Reversão: Use o indicador para identificar pavios longos que ocorrem em níveis-chave de suporte ou resistência, ou contra a tendência predominante (por exemplo, um pavio inferior longo em uma tendência de baixa para uma possível reversão de alta). Um círculo verde ou vermelho sólido indica uma reversão confirmada com base na ação do preço dentro do período de confirmação, tornando-se um sinal para considerar entrar em uma operação na direção oposta (por exemplo, comprar em uma reversão de pavio inferior vermelho, vender em uma reversão de pavio superior verde).
- Confirmação com Outras Ferramentas: Combine o indicador Long Wick com outros indicadores técnicos (por exemplo, RSI, MACD ou linhas de suporte/resistência) para confirmar sinais de reversão e evitar falsos positivos, especialmente em mercados voláteis.
- Gestão de Risco: Coloque ordens de stop-loss além do extremo do pavio (por exemplo, abaixo da mínima para uma reversão de alta) para proteger contra a possibilidade de falha da reversão, e defina níveis de take-profit baseados em suportes/resistências próximos ou numa relação risco-retorno (por exemplo, 1:2).
- Monitoramento da Taxa de Sucesso: Verifique regularmente a taxa de sucesso exibida para avaliar a eficácia do indicador ao longo do tempo e ajuste sua estratégia conforme necessário.
Ajustando Parâmetros para Melhor Uso:
- Período de Retrospectiva (Padrão: 5): Determina o número de barras usadas para calcular a faixa média da vela. Um período mais curto (por exemplo, 3-10) torna o indicador mais sensível à volatilidade recente, ideal para mercados rápidos, enquanto um período mais longo (por exemplo, 20-50) suaviza a média para condições de tendência. Ajuste conforme seu timeframe (por exemplo, menor para gráficos de 1 minuto, maior para gráficos de 1 hora).
- Período de Confirmação (Padrão: 15): Define o número de barras para confirmar uma reversão. Um período mais curto (por exemplo, 5-10) é adequado para estratégias rápidas de scalping, enquanto um período mais longo (por exemplo, 15-30) é melhor para swing trading para capturar reversões prolongadas. Aumente se notar muitas marcações amarelas onde as reversões ocorrem mais tarde.
- Multiplicador do Limite do Pavio (Padrão: 1.3): Multiplica a faixa média da vela para definir o comprimento mínimo do pavio. Valores menores (por exemplo, 1.0-1.5) detectam mais pavios (útil em mercados de baixa volatilidade), enquanto valores maiores (por exemplo, 2.0-3.0) filtram apenas os pavios mais significativos (melhor em mercados de alta volatilidade). Ajuste para equilibrar sensibilidade e qualidade do sinal.
- Período da Tendência (SMA) (Padrão: 21): Define o comprimento da SMA para filtragem de tendência. Um período mais curto (por exemplo, 10-20) responde a tendências de curto prazo, enquanto um período mais longo (por exemplo, 50-100) se alinha a tendências de longo prazo. Ajuste para combinar com seu horizonte de trading e condições de mercado.
- Proporção Mínima Pavio para Corpo (Padrão: 3): Define a proporção mínima do comprimento do pavio em relação ao tamanho do corpo. Uma proporção menor (por exemplo, 2-3) inclui mais velas com pavios moderados, enquanto uma proporção maior (por exemplo, 4-5) foca em velas com pavios muito pronunciados. Aumente para sinais de reversão mais rigorosos, diminua para mais oportunidades.
- Tolerância de Reversão (Pips) (Padrão: 5): Permite uma tolerância em pips para o preço ultrapassar o extremo do pavio antes de desqualificar uma reversão. Um valor menor (por exemplo, 2-3) garante confirmação rigorosa da reversão, enquanto um valor maior (por exemplo, 5-10) acomoda pequenos retrocessos. Ajuste com base no valor do pip e volatilidade do símbolo.
Dicas de Otimização:
- Comece com as configurações padrão e faça backtest em dados históricos para seu instrumento e timeframe preferidos.
- Em mercados com tendência, aumente o Multiplicador do Limite do Pavio e a Proporção Mínima Pavio para Corpo para focar em sinais de reversão mais fortes.
- Em mercados laterais, diminua esses parâmetros para capturar mais pavios, mas combine com um Período de Confirmação mais curto para evitar desqualificações tardias.
- Revise regularmente a taxa de sucesso e ajuste os parâmetros se ela cair abaixo do seu limite aceitável (por exemplo, 70%).
Ao personalizar esses parâmetros, os traders podem adaptar o indicador Long Wick à sua estratégia específica, aumentando sua eficácia na identificação de pontos de reversão com alta probabilidade em diversas condições de mercado.
Resumo
Traders can use the indicator to spot reversal opportunities at key support or resistance levels or against prevailing trends. It is recommended to confirm signals with other technical tools such as RSI or MACD and to apply risk management by placing stop-loss orders beyond wick extremes. The indicator’s parameters—including lookback and lookforward periods, wick threshold multiplier, SMA trend period, minimum wick-to-body ratio, and reversal tolerance—are adjustable to suit different market conditions and trading styles. Regular review of the success rate helps optimize performance.
Avaliações de clientes
5 | 0 % | |
4 | 100 % | |
3 | 0 % | |
2 | 0 % | |
1 | 0 % |


