
Descrição
O indicador baseia-se na análise da ação do preço 📈 para identificar mudanças na estrutura do mercado e áreas-chave de interesse. Abaixo está um resumo detalhado de como funciona:
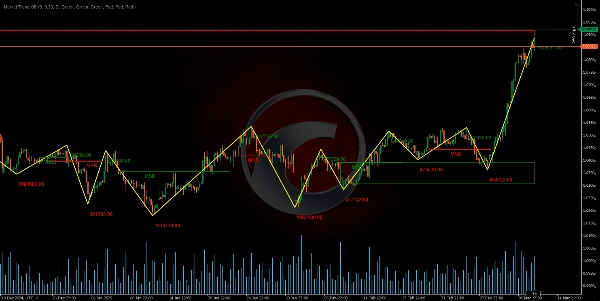
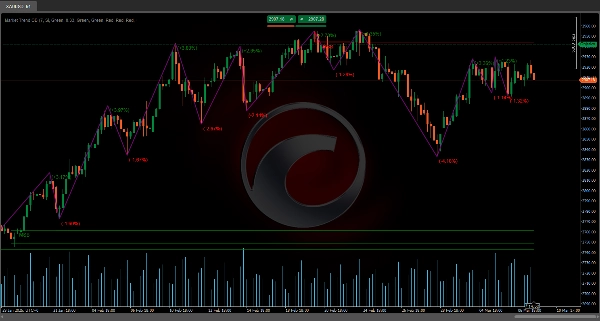
Detecção de Pivôs e Formação do Zigzag 🔄
Um período específico (definido por um parâmetro de comprimento) é analisado para identificar máximas e mínimas relativas. Comparando os preços dentro desse intervalo, pontos de pivô (pontos de inflexão) são detectados, que, por sua vez, formam o padrão zigzag ⚡. Esse padrão ajuda a distinguir quando ocorre uma reversão de preço .
Acumulação de Volume e Cálculo de Desvio 📊
Durante o processo de detecção de pivôs, o volume de ticks é acumulado no segmento avaliado. Além disso, a diferença percentual entre os preços dos pivôs é calculada para determinar se o movimento é suficientemente significativo. Esse desvio é comparado a um limite definido, o que ajuda a confirmar que a mudança na estrutura é real ✅.
Definição da Quebra da Estrutura do Mercado (MSB) 🚨
O indicador avalia os dois últimos pivôs (sejam máximas ou mínimas) e, aplicando um fator de retração (inspirado nos níveis de Fibonacci), determina se ocorreu uma quebra na estrutura .
- Se, após romper uma máxima antiga, o preço começar a gerar mínimas mais baixas, é identificada uma mudança para uma estrutura de baixa 🐻.
- Da mesma forma, se após romper uma mínima antiga, o preço gerar máximas mais altas, assume-se uma transição para uma estrutura de alta 🐂.
Essa mudança é interpretada como uma Quebra da Estrutura do Mercado (MSB).
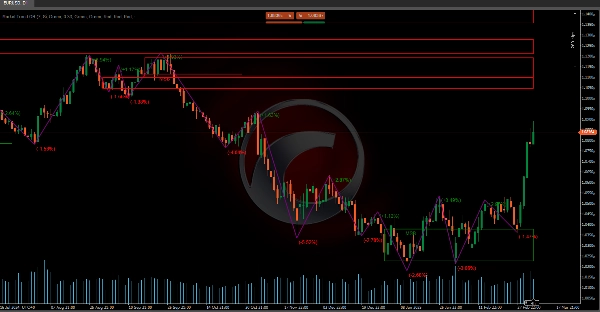
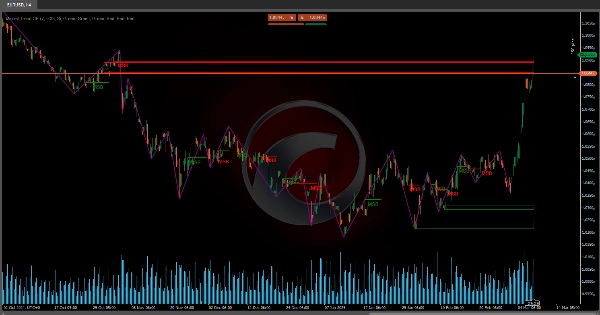
Identificação de Blocos de Ordem e Caixas de Rompimento 📦
Uma vez detectado um MSB, zonas críticas são definidas com base na ação de preço anterior:
- Blocos de Ordem (OB) 🧱: São identificados como zonas onde ocorreu a última ação significativa antes do rompimento. Em uma estrutura de baixa, é considerada a última vela de alta antes da nova máxima; em uma estrutura de alta, é usada a última vela de baixa antes da nova mínima.
- Caixas de Rompimento (BB) 📈: São determinadas de forma semelhante, mas consideram um alcance adicional para confirmar que o preço rompeu o nível anterior.
Essas zonas ajudam a definir áreas onde a atividade está concentrada e podem atuar como suporte ou resistência no futuro.
Visualização de Dados Relevantes do Zigzag 📊
Além de plotar a sequência de pivôs, o indicador incorpora dados adicionais:
- Preço de Reversão 💹: O valor exato onde a mudança de tendência é detectada é registrado.
- Variação Percentual da Reversão 🔄: A variação percentual entre o novo preço do pivô e o anterior é calculada, indicando a magnitude da mudança.
- Volume Acumulado 📉: A soma do volume de ticks durante o segmento que leva à formação do pivô é exibida.
Esses dados permitem avaliar a força e relevância do movimento sem depender de suposições, pois são baseados em cálculos concretos.
Em resumo, a ferramenta analisa a ação do preço para detectar quando o mercado muda de tendência (MSB) e define zonas (blocos de ordem e caixas de rompimento) que podem ser chave para decisões de negociação 💼. A integração do padrão zigzag com análise de volume e desvios percentuais fornece uma visão abrangente da estrutura do mercado, oferecendo informações precisas sobre pontos de reversão e a força do movimento 💪.
Indicadores da Ctrader Store:
Dynamic Market Structure
Analysis of Turning Points
Fibonacci Linear
Regression Multi-timeframe
Multi-Level Candle Bias
Tracker
Auto Support and
Resistance Trend Lines
Resumo
It defines Market Structure Breaks (MSB) by evaluating recent pivots with a retracement factor inspired by Fibonacci levels. A break in structure is signaled when price action shifts from higher highs to lower lows (bearish) or from lower lows to higher highs (bullish).
Upon detecting an MSB, the indicator identifies critical zones: Order Blocks (OB), representing the last significant candle before a breakout, and Breakout Boxes (BB), which confirm price level breaches with an additional range. These zones serve as potential future support or resistance areas.
The tool visualizes relevant zigzag data, including reversal prices, percentage changes, and accumulated volume, enabling assessment of movement strength and relevance based on concrete calculations. This comprehensive approach integrates zigzag patterns, volume analysis, and deviation metrics to provide precise information on reversal points and market movement strength, supporting informed trading decisions.
Avaliações de clientes
5 | 100 % | |
4 | 0 % | |
3 | 0 % | |
2 | 0 % | |
1 | 0 % |


