Descripción
🧠 OBScope™ – Mapeo de Bloques de Orden con Precisión para Operaciones de Alta Probabilidad
Descubre la estructura oculta del mercado con OBScope™, un indicador de vanguardia diseñado para detectar y visualizar zonas de bloques de orden de alta probabilidad basadas en máximos y mínimos oscilantes, y un análisis avanzado de la acción del precio.
Ya seas un trader experimentado o estés perfeccionando tu ventaja, OBScope™ te ofrece una vista cristalina de las huellas institucionales—donde el dinero inteligente deja su marca.
🔍 Características Clave:
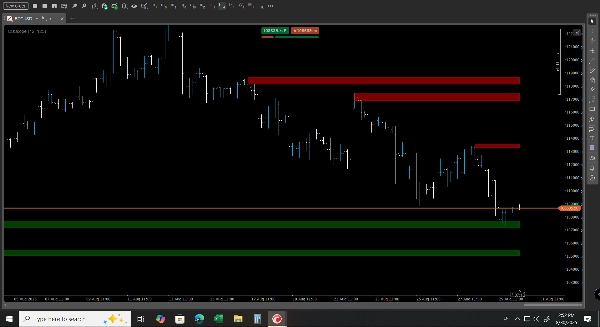
• Detección Dinámica de Bloques de Orden
Identifica y pinta automáticamente zonas donde el precio históricamente ha revertido o consolidado, usando la estructura oscilante y lógica informada por volumen.
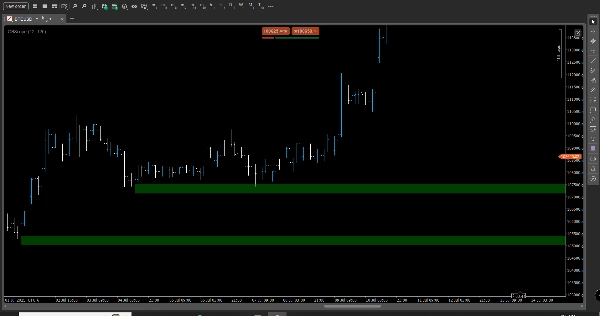
• Zonas de Operación de Alta Probabilidad
Filtra el ruido y resalta solo los bloques de orden estadísticamente más significativos—aquellos con historial probado de reacción y configuraciones óptimas de riesgo-recompensa.
• Lógica Basada en Oscilaciones
Integra el análisis de máximos/mínimos oscilantes para anclar zonas en una estructura de mercado significativa, mejorando el tiempo y el sesgo direccional.
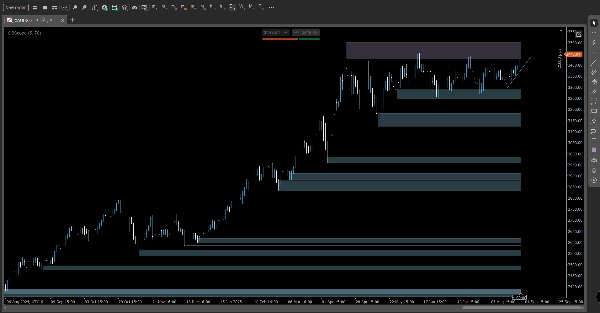
• Diseño Orientado al Rendimiento
Construido sobre algoritmos probados con validación en mercados reales, OBScope™ ha mostrado resultados consistentes en múltiples clases de activos y marcos temporales.
• Visualización Personalizable
Interfaz limpia y modular con opacidad ajustable de zonas, codificación por colores—adaptada para flujos de trabajo discrecionales y algorítmicos.
📈 Por Qué los Traders Aman OBScope™:
• Reduce las conjeturas en la identificación de zonas
• Mejora la confluencia con otras estrategias (p. ej., barridos de liquidez, rellenos de desequilibrio)
• Soporta configuraciones tanto de ruptura como de reversión
• Ideal para scalping, swing trading y desafíos de firmas propietarias
Resumen
Valoraciones de clientes
5 | 100 % | |
4 | 0 % | |
3 | 0 % | |
2 | 0 % | |
1 | 0 % |


