
⚡ カウフマン効率比率 (KER)
トレンドの明確さを数値化。
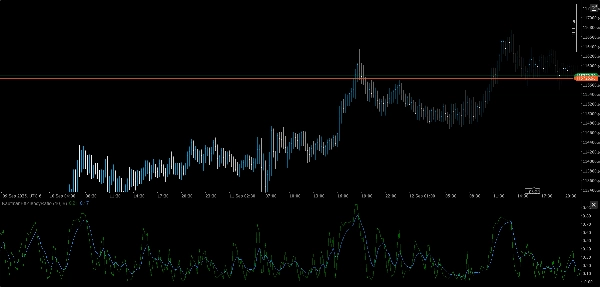
カウフマン効率比率 (KER) は、価格がポイントAからBへどれだけ効率的に動いているかを測定する精密なツールです。ノイズに惑わされることなく。ブレイクアウト条件の検証や横ばいのノイズのフィルタリングに関わらず、KERは方向性の意図とボラティリティを反映した0から1のクリーンスコアを提供します。
🔍 何をするか
- カウフマン効率比率を計算します:
- 正規化された値を出力します 0(純粋なノイズ) から 1(完璧なトレンド)
- トレンド状態と非トレンド状態を曖昧さなく強調表示します
- 適応型オーバーレイ、レジームフィルター、シグナルゲーティングに最適です
🛠️ 主な特徴
- マルチタイムフレームのソーシング用モジュラー入力マネージャー
- クロスアセット対応:FX、暗号通貨、指数、株式
- スムージング遅延のない軽量リアルタイムロジック
- 既存のスイートアーキテクチャにプラグアンドプレイで対応
🎯 利用ケース
- トレンド検証:シグナル実行前に方向性バイアスを確認
- ノイズフィルタリング:非効率な価格変動時のエントリーを抑制
- レジーム検出:ボラティリティ対応オーバーレイと組み合わせてスマートな遷移を実現
- 戦略構築:ブレイクアウト、モメンタム、バイアスロジックのコア指標として使用
💡 ボーナス
KERは無料で高速、そして徹底的に効率的です—まさにあなたのコードのように。無駄なく、フィルターなし。ただ純粋な市場の意図を抽出します。
インジケーターのプロフィール
0.0
レビュー: 0
カスタマーレビュー
この商品にはまだレビューがありません。お使いになったことがある方は、ぜひレビューをお願いします。
Breakout
Scalping
AI
cTrader Storeで入手可能な取引ボット、インジケーター、プラグインなどの商品は、第三者の開発者が提供するものであり、情報と技術の取得のみを目的としてご利用いただけます。cTrader Storeはブローカーではなく、投資助言や個人的な推奨を行うことも、将来のパフォーマンスを保証することもありません。


25
販売
2.1K
無料インストール