
Descripción
Esta lista describe los ajustes avanzados y las características de un indicador de Smart Money Concepts (SMC). Está diseñado para automatizar el análisis técnico de la estructura del mercado, la oferta/demanda y la liquidez.
Aquí tienes un desglose directo de lo que hacen estos ajustes:
🏗️ Estructura del Mercado y Acción del Precio
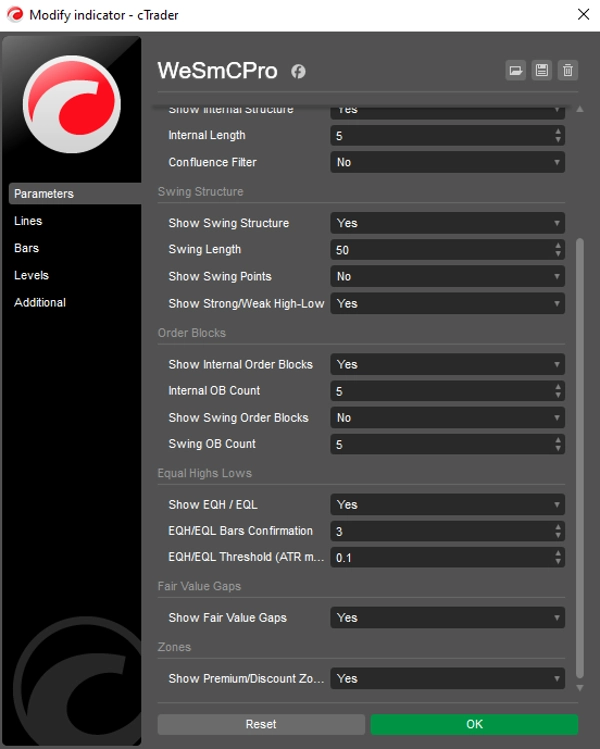
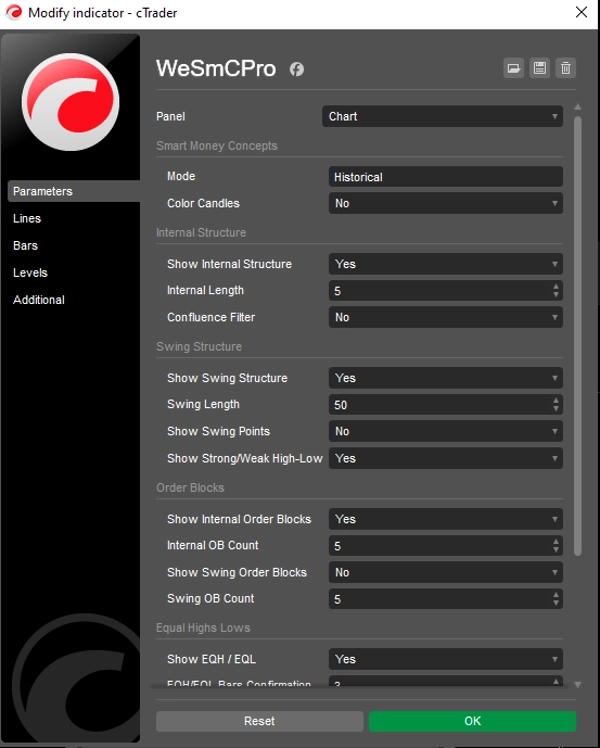
- Modo (Histórico/Presente): Elige entre ver todos los datos pasados (backtesting) o solo la estructura actual en vivo para mantener tu gráfico limpio.
- Estructura Interna vs. Swing: * Interna: Muestra rupturas "menores" (BOS/CHoCH) dentro de una tendencia.
-
- Swing: Muestra cambios de tendencia "mayores" usando líneas sólidas y etiquetas más grandes.
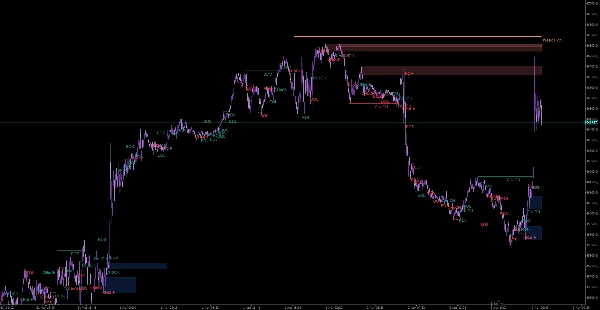
- Puntos Swing: Etiqueta automáticamente los máximos y mínimos (HH, HL, LH, LL) para que no tengas que identificar la tendencia manualmente.
- Máximos y Mínimos Iguales (EQH/EQL): Identifica posibles soportes/resistencias "minoristas" donde usualmente se encuentra la liquidez institucional. La Confirmación de Barras filtra los máximos/mínimos iguales "falsos".
🧱 Oferta, Demanda y Desequilibrio
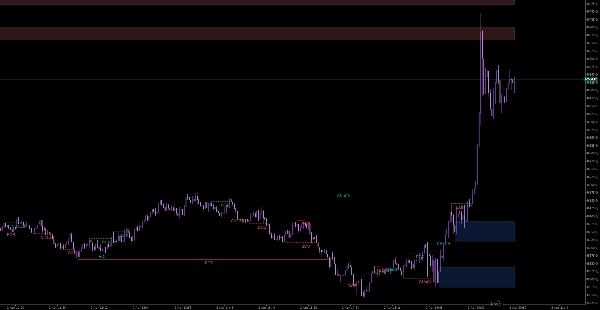
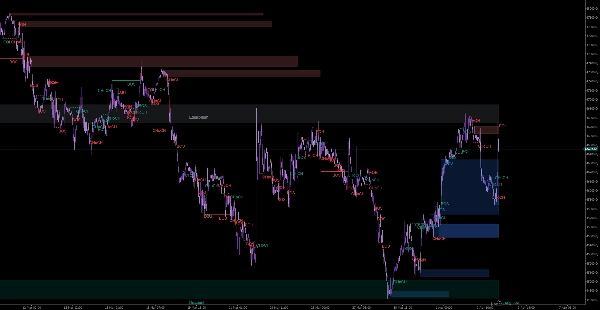
- Bloques de Orden (Internos y Swing): Resalta la "última vela" antes de un gran movimiento donde probablemente las instituciones tienen órdenes pendientes. Puedes limitar cuántos se muestran para evitar "desorden".
- Brechas de Valor Justo (FVG): Resalta desequilibrios de precio (brechas).
-
- Umbral Automático: Filtra brechas pequeñas e insignificantes.
- Marco Temporal: Te permite ver FVGs de un marco temporal superior mientras permaneces en tu gráfico actual.
- Extender FVG: Proyecta la brecha hacia adelante para que puedas ver cuándo el precio eventualmente regresa a ella.
📊 Contexto y Confluencia
- Máximos y Mínimos MTF: Traza los máximos/mínimos diarios, semanales y mensuales previos. Estos son niveles "imán" donde el precio suele reaccionar.
- Zonas de Prima/Descuento: Divide un rango de negociación en tres partes:
-
- Prima: El precio es caro (busca ventas).
- Equilibrio: Valor justo.
- Descuento: El precio es barato (busca compras).
- Filtro de Confluencia: Un interruptor "inteligente" que oculta rupturas de estructura débiles, mostrando solo movimientos que tienen un alto impulso o volumen detrás.
Resumen
Resumen de IA
WeSmCPro is a Smart Money Concepts (SMC) trading indicator designed to automate technical analysis by identifying market structure, supply and demand zones, and liquidity areas. It offers two modes: Historical for backtesting and Present for live market structure visualization. The indicator distinguishes between internal (minor) and swing (major) trend structures, automatically labeling swing points such as higher highs, higher lows, lower highs, and lower lows.
Key features include detection of equal highs and lows to identify potential retail support and resistance zones, with filters to reduce false signals. It highlights order blocks—candles preceding significant moves where institutional orders may rest—and fair value gaps (price imbalances), with options to filter insignificant gaps, view higher timeframe gaps on the current chart, and extend gaps forward for tracking price return.
For broader context, WeSmCPro plots multi-timeframe daily, weekly, and monthly highs and lows, which often act as price magnets. It divides trading ranges into premium (expensive), equilibrium (fair value), and discount (cheap) zones to assist in identifying potential sell or buy areas. A confluence filter helps focus on strong structure breaks supported by momentum or volume. The indicator supports various markets including Forex, cryptocurrencies, indices, commodities, and stocks.
Perfil del indicador
Valoraciones de clientes
0.0
Valoraciones: 0
Valoraciones de clientes
Este producto todavía no se ha valorado. ¿Ya lo ha probado? Sea el primero en informar a otros.
Conversación
Preguntas frecuentes
BTCUSD
Forex
Signal
Breakout
Indices
EURUSD
Commodities
GBPUSD
NZDUSD
Martingale
Prop
Scalping
SMC
Crypto
Grid
Stocks
AI
XAUUSD
NAS100
USDJPY
Los productos disponibles a través de cTrader Store, incluidos bots, indicadores y plugins para operar, son proporcionados por desarrolladores de terceros y están disponibles únicamente con fines informativos y de acceso técnico. cTrader Store no es un bróker, por lo que no proporciona asesoramiento de inversión, recomendaciones personales ni ninguna garantía de rentabilidad futura.
Más de este autor


![Logotipo de "[Hamster-Coder] Moving Average MTF"](https://cdn.ctrader.com/image/webp/b11b98b1-194d-4b8e-b00e-d611826ad159_31226)


Precio
2.76K
Instalaciones gratis