
Descripción
VOLUME HEATMAP PRO - Visualización Profesional de la Densidad del Mercado
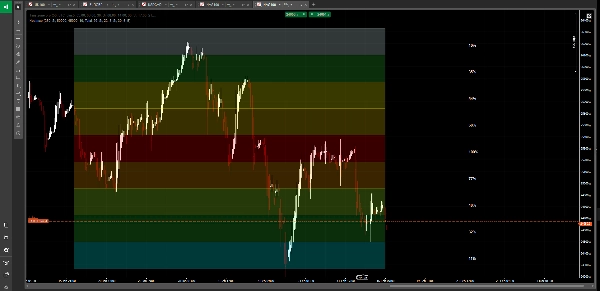
Vea el mercado como nunca antes con este avanzado mapa de calor de volumen que transforma datos complejos de volumen en una visualización intuitiva. A diferencia de los indicadores de volumen tradicionales que solo muestran barras en la parte inferior de su gráfico, Volume Heatmap Pro revela exactamente dónde los traders institucionales están acumulando y distribuyendo posiciones en cada nivel de precio.
CARACTERÍSTICAS PRINCIPALES:
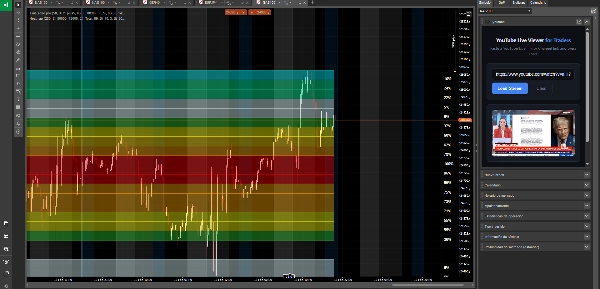
🔥 Mapa de Calor Dinámico Codificado por Colores
Experimente el análisis de volumen a través de un impresionante sistema de gradiente de color de 10 niveles. Desde azul hielo (actividad mínima) hasta rojo intenso (volumen máximo), identifique al instante dónde fluye el dinero grande. El mapa de calor se actualiza en tiempo real, mostrándole la densidad del mercado de un vistazo.
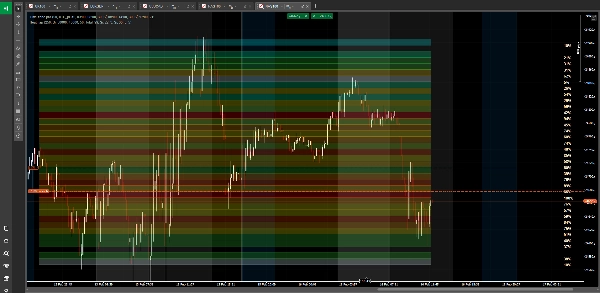
📍 Detección del Punto de Control (POC)
Identifica y resalta automáticamente el nivel de precio con el mayor volumen de negociación, el verdadero punto de equilibrio del mercado. Aquí es donde las instituciones han construido sus posiciones más grandes y donde el precio tiende a regresar.
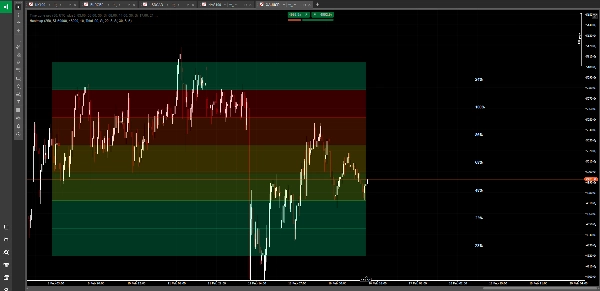
🎯 Distribución de Volumen Multinivel
Divide su rango de precios en hasta 50 niveles precisos, creando un mapa detallado de la distribución del volumen. Vea exactamente qué precios atrajeron un alto volumen de negociación y cuáles fueron ignorados por el mercado.
📊 Tres Modos de Análisis de Volumen
• Volumen Total - Vea toda la actividad del mercado
• Solo Volumen de Compra - Aísle zonas de presión alcista
• Solo Volumen de Venta - Identifique áreas de distribución bajista
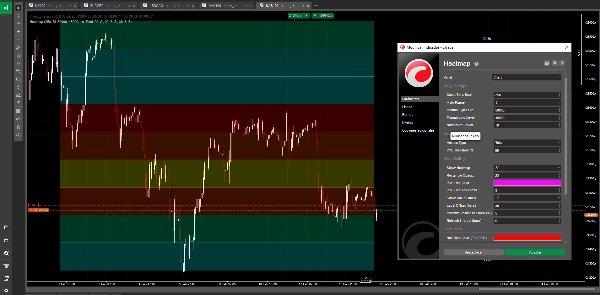
🎨 Visualización Profesional
• Rectángulos codificados por colores que abarcan su período de análisis
• Opacidad ajustable para una integración perfecta en el gráfico
• Etiquetas opcionales de porcentaje de volumen en cada nivel
• Línea POC personalizable con control de grosor
• Visualización limpia y no intrusiva
⚙️ Tecnología Inteligente de Auto-Rango
Calcula automáticamente el rango de precios óptimo a partir de su período de retroceso, o defina manualmente su propio rango para análisis específicos. El mapa de calor se adapta a cualquier condición de mercado o marco temporal.
🔄 Rendimiento Optimizado
Los intervalos de actualización configurables aseguran un rendimiento fluido del gráfico mientras mantienen un análisis de volumen preciso. Analice hasta 500 barras hacia atrás sin retrasos.
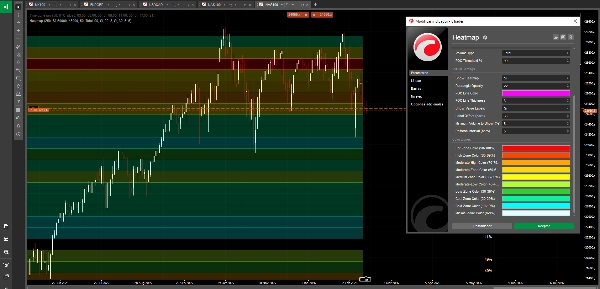
📈 Zonas de Color Personalizables
Personalice las 10 zonas de color para que coincidan con sus preferencias visuales:
• Zona Caliente (90-100%) - Concentración máxima de volumen
• Zona Alta (80-89%) - Actividad fuerte
• Moderado-Alto (70-79%) - Volumen por encima del promedio
• Moderado (60-69%) - Actividad sólida
• Medio (50-59%) - Volumen promedio
• Moderado-Bajo (40-49%) - Por debajo del promedio
• Zona Baja (30-39%) - Actividad ligera
• Zona Fría (20-29%) - Negociación mínima
• Zona Muy Fría (10-19%) - Volumen muy ligero
• Mínimo (0-9%) - Casi sin actividad
PERFECTO PARA:
• Identificar zonas de acumulación y distribución institucional
• Encontrar nodos de bajo volumen para posibles áreas de ruptura
• Detectar niveles de soporte y resistencia con alto volumen
• Entender la estructura del mercado y la liquidez
• Confirmar entradas de operaciones en áreas de alto volumen
• Evitar zonas trampa de baja liquidez
• Análisis de perfil de volumen en múltiples marcos temporales
LO QUE LO HACE DIFERENTE:
Los indicadores de volumen tradicionales le muestran CUÁNTO se negoció, pero no DÓNDE. Volume Heatmap Pro revela la imagen completa: un mapa visual de densidad que muestra exactamente qué niveles de precio absorbieron la mayor actividad de negociación. El sistema de colores en gradiente hace que el análisis complejo de volumen sea tan simple como leer un mapa del tiempo. Rojo significa caliente (volumen alto), azul significa frío (volumen bajo).
Ya sea que esté haciendo scalping en reversales intradía o posicionándose para operaciones swing, este mapa de calor le muestra dónde el mercado tiene verdadera convicción frente a donde es solo ruido.
---
⚠️ AVISO DE RIESGO:
Operar con divisas extranjeras, criptomonedas y otros instrumentos financieros conlleva un alto nivel de riesgo y puede no ser adecuado para todos los inversores. El alto grado de apalancamiento puede actuar en su contra así como a su favor. Antes de decidir operar, debe considerar cuidadosamente sus objetivos de inversión, nivel de experiencia y apetito por el riesgo. Existe la posibilidad de que pueda sufrir una pérdida de parte o la totalidad de su inversión. Por lo tanto, no debe invertir dinero que no pueda permitirse perder. Debe estar consciente de todos los riesgos asociados con el trading y buscar asesoramiento de un asesor financiero independiente si tiene alguna duda. El rendimiento pasado no es indicativo de resultados futuros.
Resumen
Key features include automatic Point of Control (POC) detection, highlighting the price level with the highest trading volume, and multi-level volume distribution dividing the price range into up to 50 levels for detailed analysis. It supports three volume modes: total volume, buy volume only, and sell volume only, enabling users to isolate bullish or bearish pressure zones.
The indicator offers professional visualization with adjustable opacity, customizable color zones, optional volume percentage labels, and a customizable POC line. Smart auto-range technology calculates optimal price ranges based on the lookback period or manual input. Performance is optimized for smooth updates and analysis of up to 500 bars without lag.
Heatmap is suitable for identifying institutional accumulation and distribution zones, spotting support and resistance levels, understanding market structure, and conducting multi-timeframe volume profile analysis across markets including Forex, indices, and XAUUSD (gold).
Valoraciones de clientes
5 | 67 % | |
4 | 33 % | |
3 | 0 % | |
2 | 0 % | |
1 | 0 % |


