
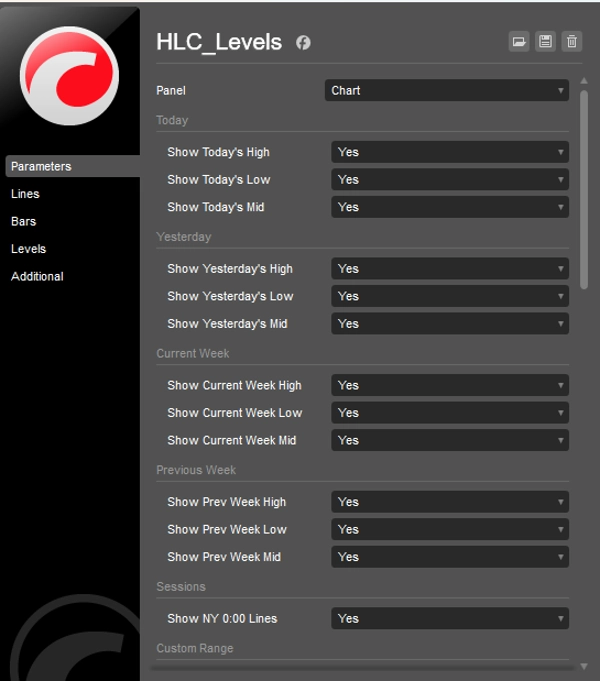
HLC_Levels
Indicador
4 compras
Versión 1.0, Feb 2026
Windows, Mac
4.3
Valoraciones: 3
Descripción
Descripción:
Deja de dibujar líneas manualmente todos los días. Niveles Avanzados HLC y de Sesión es un indicador integral diseñado para traders profesionales que dependen de puntos de referencia institucionales. Ya sea que operes con Price Action, conceptos ICT o estrategias de ruptura, esta herramienta mantiene tu gráfico limpio y tus niveles precisos.
Características Clave:
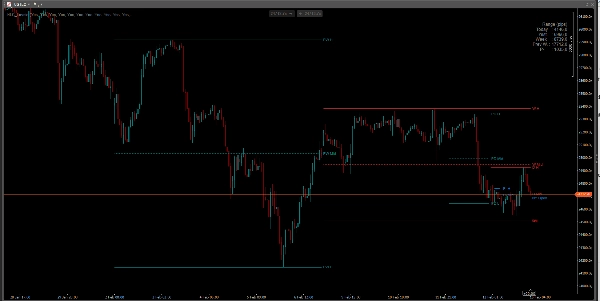
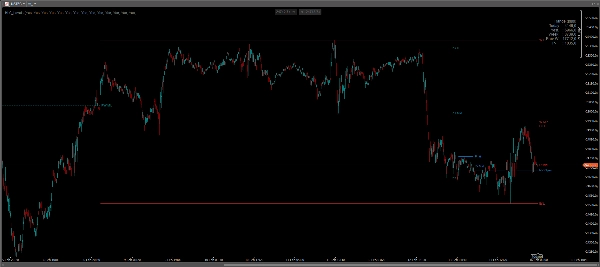
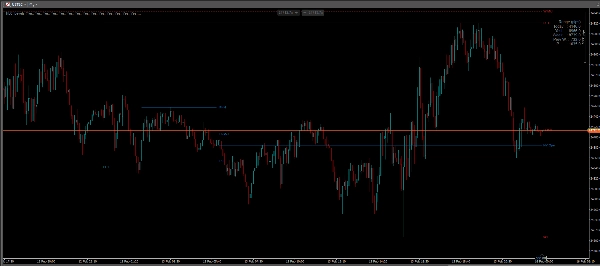
- Niveles Diarios: Muestra automáticamente los niveles Alto, Bajo y Medio (50%) de Hoy y Ayer.
- Niveles Semanales: Visualiza los niveles Alto, Bajo y Medio de la Semana Actual y la Semana Anterior.
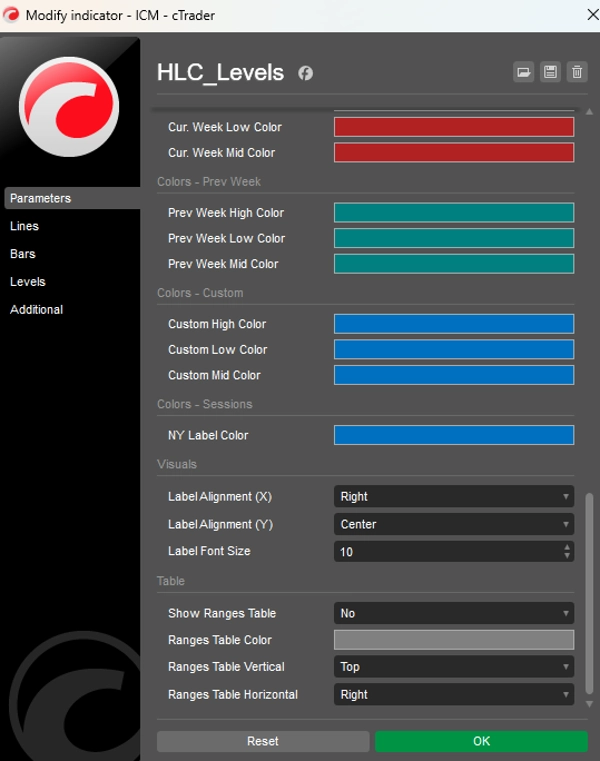
- Apertura de Medianoche en NY: Un interruptor dedicado para el nivel de precio institucional de Nueva York a las 00:00 (Apertura Real del Día), crucial para la dirección del sesgo.
- Rango / Sesión Personalizada: Define tu propia ventana de tiempo (por ejemplo, Sesión de Asia, Apertura de Londres o Balance Inicial). El indicador dibujará el Alto, Bajo y Medio para ese período específico.
- Panel de Volatilidad: Una tabla en el gráfico que muestra el rango de pips (Alto menos Bajo) para el Día, Ayer, Semana, Semana Anterior y tu Rango Personalizado.
- Inteligencia de Zona Horaria: Funciona con la hora del Broker, UTC, NY o la hora Local para asegurar que los niveles se alineen con tu estrategia.
¿Por qué usar este indicador?
- Puntos de Reacción: Los Altos/Bajos antiguos y los puntos medios a menudo actúan como soporte y resistencia fuertes.
- Medio (Equilibrio): El nivel del 50% es clave para identificar precios "Descuento" vs "Prima".
- Totalmente Personalizable: Activa o desactiva cualquier línea. Cambia colores, estilos de línea y posiciones de etiquetas para que coincidan con tu plantilla.
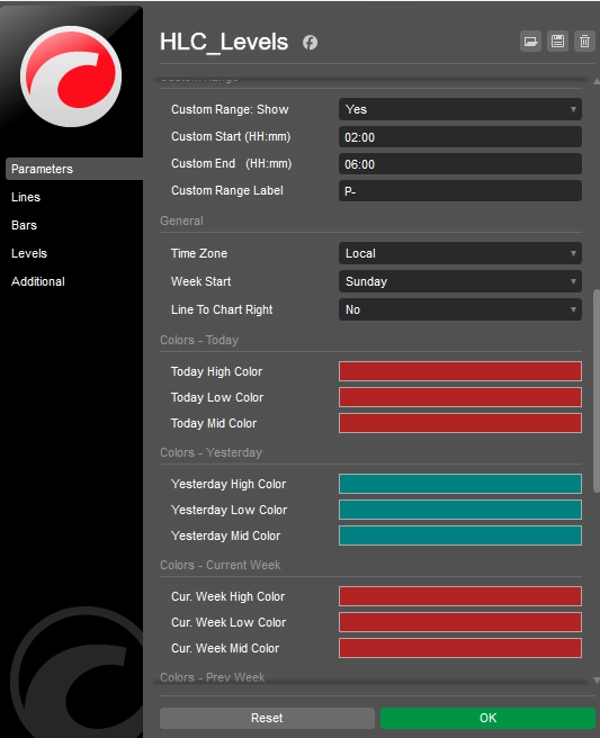
Configuraciones:
- Habilita/Deshabilita marcos de tiempo específicos (Hoy, Ayer, Semana, Semana Anterior).
- Tiempos personalizados de inicio/fin para rangos de sesión específicos.
- Opción "Extender Líneas" para proyectar niveles hacia el futuro.
- Colores personalizados para cada grupo de líneas.
Resumen
Perfil del indicador
Valoraciones de clientes
4.3
Valoraciones: 3
5 | 33 % | |
4 | 67 % | |
3 | 0 % | |
2 | 0 % | |
1 | 0 % |
Valoraciones de clientes
May 16, 2026
Bit weird to see there is no Close level eventhough it's called HLC_levels.. There is a high and low and a mid, but no close. I kinda find it essential to have a close though. Other than that is safes me huge amount of time daily to not set all these levels manually. So besides the lack of the close level i still like this indicator. Would love to see a new version with the added close level as the name suggests
March 2, 2026
A 5 minute check should not become a 30 minute rabbit hole, and the entry needs one more reason to make sense.
February 21, 2026
most of the value comes from the decision gets a little more breathing room. The market context still matters.
Conversación
Preguntas frecuentes
Prop
Forex
Scalping
Indices
SMC
AI
XAUUSD
NAS100
USDJPY
Los productos disponibles a través de cTrader Store, incluidos bots, indicadores y plugins para operar, son proporcionados por desarrolladores de terceros y están disponibles únicamente con fines informativos y de acceso técnico. cTrader Store no es un bróker, por lo que no proporciona asesoramiento de inversión, recomendaciones personales ni ninguna garantía de rentabilidad futura.


Precio
24
Ventas
662
Instalaciones gratis