
Descripción
HCCC MTF - Canal Compuesto del Ciclo Hurst (100% GRATIS)
Resumen
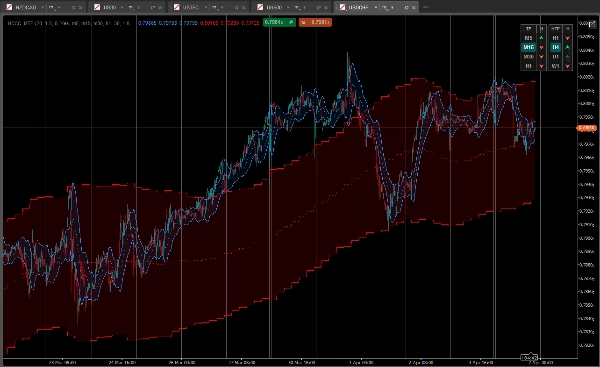
El HCCC MTF (Canal Compuesto del Ciclo Hurst) es un panel de control e indicador de canal Multi-Timeframe (MTF) avanzado y totalmente interactivo. Basado en las teorías cíclicas de J.M. Hurst combinadas con la volatilidad ATR, esta herramienta te ayuda a identificar la verdadera tendencia del mercado y los puntos de giro cíclicos perfectos (picos y valles) en múltiples marcos temporales simultáneamente.
El segundo dedicado al trading semi-automático con https://ctrader.com/products/3618?u=cLogic
IMPORTANTE: Este indicador es completamente 100% GRATIS para todos. Fue desarrollado específicamente como el compañero visual definitivo para el cBot "Follow The Trend XAU Edition".
Aunque puedes usarlo perfectamente para trading manual, su verdadero poder se desbloquea cuando se usa en una configuración semi-automatizada: Usas el Panel HCCC para leer el ciclo y el impulso en marcos temporales superiores, y luego activas el cBot Follow The Trend XAU Edition para ejecutar y gestionar con precisión las operaciones en esa dirección.
Características clave
1. Panel MTF interactivo (clickeable)
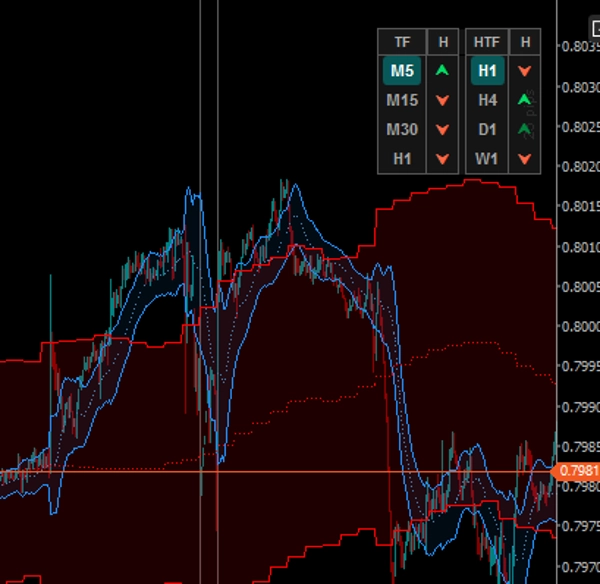
Olvídate de cambiar constantemente entre gráficos. El panel en el gráfico rastrea 4 marcos temporales inferiores (LTF) y 4 marcos temporales superiores (HTF).
- Botones LTF: Haz clic en cualquier botón LTF para cambiar instantáneamente el marco temporal de tu gráfico actual.
- Botones HTF: Haz clic en cualquier botón HTF para proyectar instantáneamente el canal de ese marco temporal superior directamente en tu gráfico actual.
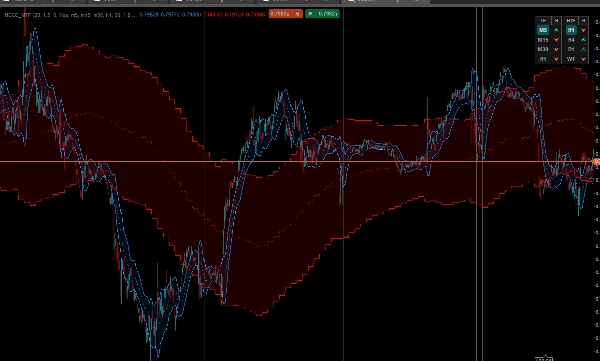
2. Sistema de superposición de doble canal
El indicador traza dos canales elegantes, llenos de nubes, en tu gráfico al mismo tiempo:
- Ciclo de entrada (Nube azul): Calcula el ciclo Hurst basado en el marco temporal actual de tu gráfico.
- Ciclo de tendencia (Nube roja): Un canal de vista macro calculado desde el marco temporal superior que seleccionaste en el panel.
3. Señales cíclicas avanzadas de 5 estados
El panel no solo muestra la dirección de la tendencia; muestra la fase del ciclo analizando la pendiente de la línea media y la posición del precio respecto a las bandas ATR.
- [ ⮝ ] Verde oscuro (Compra fuerte): La pendiente media está AL ALZA, y el precio ha caído a la banda inferior. Este es un valle cíclico (compra en la caída).
- [ ⮝ ] Verde claro (Compra débil): La tendencia está AL ALZA, pero el precio se mantiene alrededor de la banda media o superior.
- [ — ] Gris (Neutral): El ciclo está plano. Sin impulso claro.
- [ ⮟ ] Rojo claro (Venta débil): La tendencia está A LA BAJA, pero el precio está cerca de la media.
- [ ⮟ ] Rojo oscuro (Venta fuerte): La pendiente media está A LA BAJA, y el precio ha subido a la banda superior. Este es un pico cíclico (vende en el repunte).
¿Cómo usarlo con el cBot "Follow The Trend XAU Edition"?
- Mira el lado derecho del panel (Columna HTF). Espera una alineación clara en los marcos temporales superiores (por ejemplo, H4 y D1 mostrando flechas verdes oscuras/claro).
- Mira el lado izquierdo del panel (Columna LTF) para encontrar un retroceso localizado (por ejemplo, M15 mostrando una flecha verde oscura de "Compra fuerte").
- Una vez que la lógica MTF se alinea, activa tu cBot Follow The Trend XAU Edition en la dirección "COMPRA" y deja que sus algoritmos manejen la entrada, los stops móviles y la gestión del riesgo.
Personalización
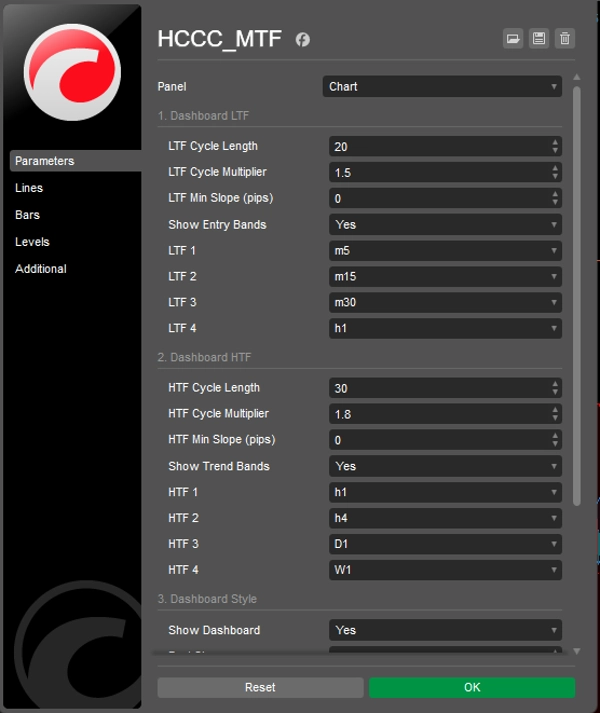
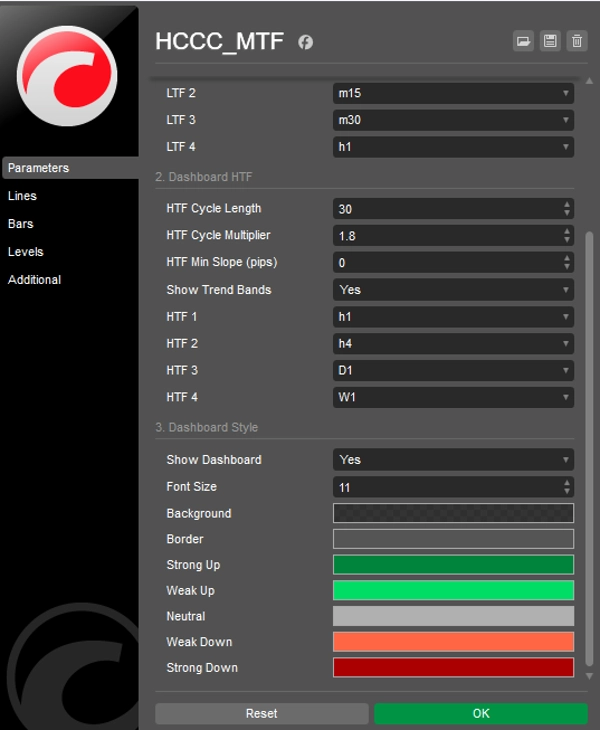
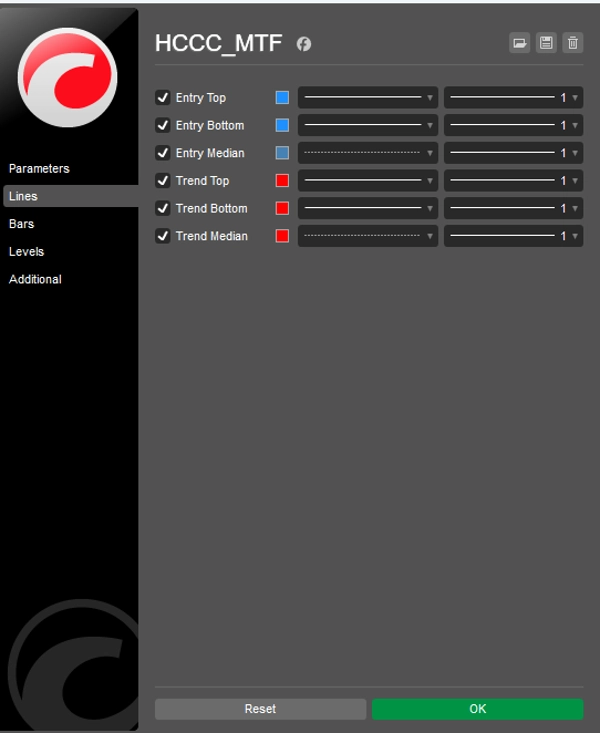
Todo es totalmente personalizable: longitudes de ciclo, multiplicadores ATR, sensibilidad mínima de pendiente (en pips) para filtrar el ruido, y control total sobre los colores y la posición de la interfaz de usuario.
¡Descárgalo ahora GRATIS y lleva tu trading semi-automatizado al siguiente nivel!
Resumen
It overlays two cloud-filled channels: a blue "Entry Cycle" channel based on the current timeframe and a red "Trend Cycle" channel derived from a selected higher timeframe. The dashboard provides advanced five-state cyclic signals indicating strong or weak buy/sell conditions and neutral phases by analyzing the slope of the median line and price position relative to ATR bands.
The indicator is fully customizable, including cycle lengths, ATR multipliers, slope sensitivity, and UI appearance. It is intended to complement the "Follow The Trend XAU Edition" cBot by providing visual cycle and momentum analysis to guide semi-automated trade execution and management. The HCCC MTF supports various markets including Forex, commodities, indices, stocks, and cryptocurrencies.