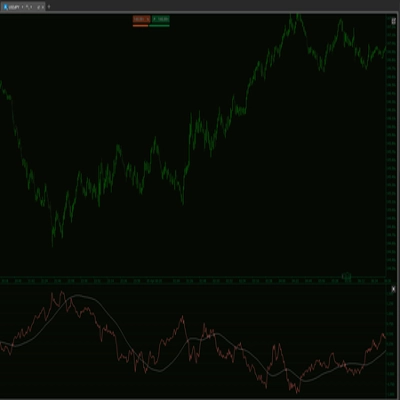
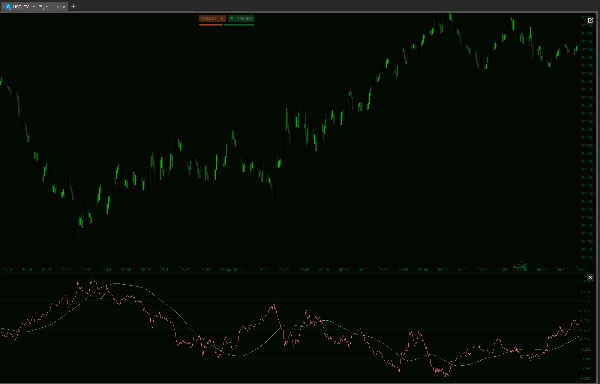
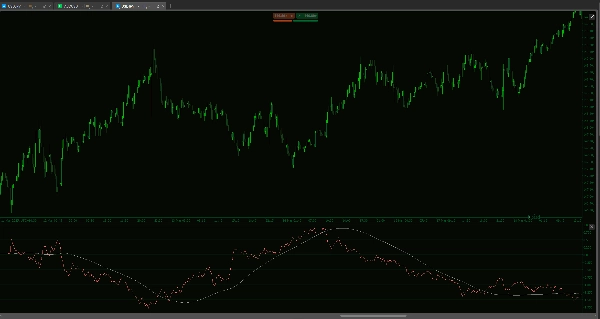
指标
Indices
Forex
USDJPY
JPYX w HMA
"JPYX w HMA" 标识
03/09/2025
21
Desktop
Since 14/01/2025
销售
26
Free installs
5321
"JPYX w HMA" 已上传图片"JPYX w HMA" 已上传图片

Introducing the Historical JXY Yen Index Indicator – the ultimate tool for gauging the strength of the Japanese Yen against major currencies. This advanced cTrader indicator synthesizes data from six key Yen pairs (EURJPY, GBPJPY, AUDJPY, NZDJPY, CADJPY, USDJPY) with customizable weightings to deliver a comprehensive, real-time picture of Yen performance.

Key Features:

  • Comprehensive Currency Blend:
    Integrates six pivotal Yen pairs, each weighted to reflect their market impact. The inverted percentage change mechanism ensures that as a pair strengthens against the Yen, its contribution accurately signals the Yen’s overall performance.
  • Multi-Layered Trend Analysis:
    Benefit from a suite of smoothing tools including an optional SMA and dual Hull Moving Averages (short and long term) that filter out noise and highlight true market trends, giving you the clarity to make confident trading decisions.
  • Customizable & Robust:
    Adjust parameters like the candle lookback count, weightings, and moving average periods to tailor the indicator to your unique trading style. Optional session resets keep your analysis fresh and aligned with the start of new trading sessions.
  • Actionable Insights:
    Whether you're tracking subtle shifts or major trends, the Historical JXY Indicator provides the actionable insights you need to capitalize on the momentum of the Yen.

Elevate your trading strategy with this cutting-edge technical tool. Harness the power of the Historical JXY Yen Index Indicator and turn complex market data into clear, strategic trading opportunities.


--------------------------

Please feel free to check out my other indicators!

https://ctrader.com/products/1181

https://ctrader.com/products/1182

https://ctrader.com/products/1180

https://ctrader.com/products/1015

https://ctrader.com/products/555

https://ctrader.com/products/553

https://ctrader.com/products/554

https://ctrader.com/products/552

https://ctrader.com/products/557

https://ctrader.com/products/845

https://ctrader.com/products/848

https://ctrader.com/products/847

https://ctrader.com/products/846

https://ctrader.com/products/551

https://ctrader.com/products/574

https://ctrader.com/products/573

https://ctrader.com/products/556

https://ctrader.com/products/558

https://ctrader.com/products/559

https://ctrader.com/products/560


该作者的其他作品
Market Sessions - Free
Track major trading sessions (Tokyo, London, New York) with customizable colors and visual sessions on your chart.
Supply Demand V1-Premium
Auto-detect supply & demand zones, remove broken levels, and trade smarter with real-time alerts. Precision made simple.
Supply Demand - BasicV1
Supply and demand zones. They're important. Here's a free version to get you started!
MTF Candle Window - On Chart
The Multi-Timeframe Candle Indicator displays candles from multiple timeframes in one window, enhancing market analysis!
指标
VWAP
VWAP - London Open
VWAP Set to London Open
Volume Profile Triple Line - POC Median Mode
The Advanced Volume Profile Indicator calculates POC, Median, and Mode, revealing key price levels for smarter trading.
指标
Forex
Market Sessions V2_NSC
Market Session V2: Full Control. colors, history, session/text toggles, font size. Elevate your strategy!
MTF Candle Countdown
Stay ahead with a real-time countdown to candle closes on all key timeframes: 5m, 15m, 30m, 1H, 4H, and Daily.
指标
VWAP
VWAP Tokyo Open
VWAP Set to Tokyo Open
Supply Demand Premium V2_NSC
The long awaited new and improved Supply Demand Premium V2 indicator. Unlock greater trading opportunities now!
Open Trade PipsV1
This indicator tracks the unrealised amount of pips in your open positions.
Commodity Channel Index Smoothed w Alerts_NSC
Smoothed CCI alerts! Audio & arrow signals for +/-100 crosses. Custom sounds & arrow filters. Precision trading!
指标
Indices
Forex
EURUSD
+2
US Dollar Index
US Dollar Index
指标
Indices
Commodities
CCI - With Arrows and 40 80 EMA Logic_noSourceCode
The Advanced CCI & EMA Indicator combines the CCI with 40 & 80 EMA logic to generate precise arrows signaling direction
Open Trade ProfitV1
A simple indicator that tracks the value of your open trades in pips.
指标
Forex
Market Session V3_NSC
Version 3: Full control of session display including start and end times of all 3 sessions!
指标
Indices
Forex
EURUSD
+1
DXY w HMA
DXY HMA Indicator
指标
Signal
USDJPY
On Balance Volume USD - Combined
See USD demand in one line—Composite OBV fuses six major FX pairs into a clear momentum gauge.
猜您喜欢
指标
Indices
Prop
Stocks
+6
New Way Sar - Pro
The Parabolic SAR, or "Stop and Reverse," is a dynamic technical analysis tool
指标
NAS100
Breakout
XAUUSD
+12
Cross EMA Pro
Cross EMA Pro – Trend Reversal Indicator
指标
Indices
CustomADX
Custom ADX Indicator for precise trend analysis. المؤشر المخصص ADX لتحليل الاتجاه بدقة
KANDIKA HEAT MAP
Color-Based Market Pressure & Volatility Visualizer The Kandika Heatmap Indicator
指标
NAS100
NZDUSD
XAUUSD
+10
RT Moving Average PRO v1.1
Customize your Moving Average! Choose any timeframe and price source for precision and flexibility in your analysis.
指标
Indices
RSI
XAUUSD
+9
Advanced HTF Trend Buy & Sell Trading System
Detects breakouts 📈 auto-draws levels 🚀 confirms trends 🐻 dynamic signals 🎨 customizable for any asset & timeframe.
指标
Signal
[Stellar Strategies] Wave Trend Pro
Momentum oscillator identifying reversals using dual WaveTrend lines, histogram, and OB/OS levels with optional signals.
BWMFI_Visual
BW_MFI Vizual colors bars
Morning Star On Chart
Morning Star pattern on chart (Bullish and Bearish) automatically marked with (BUY & SELL) Very powerful signals.
指标
MACD
IR Macd + MacdLine
some user add moving average to macd to see better. in ctrader 4.3.11 there is a problem with this . I make a macd tha
Insider_CumulativeDelta
Robust Cumulative delta,Atr and imbalance indicator.
Vishal Volume Profile v2.0
Volume Profile plots traded volume at each price level, highlighting high activity zones of precise support & resistance
评分最高
免费
High TF Plotter
Captra High TF Plotter visualizes high timeframe Bar on lower timeframe charts, highlighting with bull/bear colors.
指标
RSI
XAUUSD
ATR
+3
RSI NextGen
The RSI NextGen is an advanced and modernized version of the classic Relative Strength Index (RSI)
Blocks Liquidity MGC
BlocksLiquidity Indicator Analysis!
OHLC PRO by LudwigICT
OHLC PRO – Advanced Session & Market Structure Tool
[Stellar Strategies] BOS Trend 1.0
[Stellar Strategies] BOS Trend: Premium multi-timeframe BOS indicator for precision trend analysis.📈📉
[Stellar Strategies] Inside Bar with Signals
Visually master the Inside Bar strategy with clear breakout signals and professional chart highlighting 📈🔔📉