
说明
趋势周期 是一个专注于 趋势持续时间 的趋势分析工具,而不仅仅是方向。
它:
- 基于 Hull 移动平均线 (HMA) 的斜率检测 看涨 和 看跌 趋势。
- 计算 当前趋势 活跃了多少根柱子(实际长度)。
- 分别存储最近的 上涨趋势 和 下跌趋势 的长度。
- 计算看涨和看跌趋势的 平均长度(看涨平均 / 看跌平均)。
- 绘制:
-
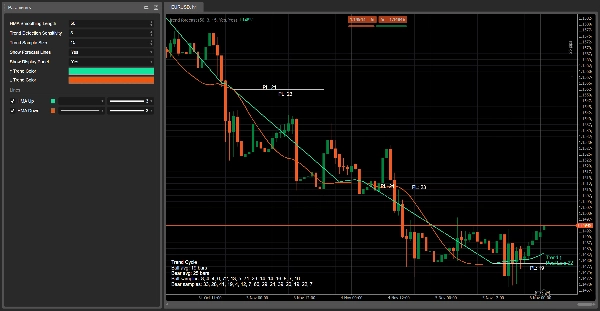
- 看涨趋势期间的 绿色 HMA 和看跌趋势期间的 红色 HMA。
- 每个趋势开始处的水平 投影线,带有类似
PL: 18(柱子中的可能长度)的标签。 - 显示当前价格附近的 实时标签,显示趋势方向和实际长度。
- 带有以下内容的 显示面板:
-
- 看涨和看跌趋势的平均持续时间,
- 最近趋势长度的列表(最多到所选样本大小)。
目标是帮助你回答:
“这个趋势有多老,类似的趋势通常持续多久?”
工作原理(逻辑)
- Hull 移动平均线 (HMA)
该指标使用 HMA 平滑长度 参数计算收盘价的 Hull 移动平均线。
HMA 比简单移动平均/指数移动平均更平滑,但对方向变化反应迅速。 - 通过斜率检测趋势
在过去 趋势检测灵敏度 根柱子内,检查 HMA:
只要定义了趋势,计数器(实际长度)每根柱子增加,表示 当前趋势的持续时间。 -
- 如果 HMA 一直 严格上升 → 趋势为 看涨 (↑)。
- 如果 HMA 一直 严格下降 → 趋势为 看跌 (↓)。
- 否则,保持之前的趋势状态。
- 记录趋势长度
当趋势从看涨转为看跌或反之时: -
- 存储 已完成趋势的持续时间:
-
- 看涨趋势存入 看涨列表,
- 看跌趋势存入 看跌列表。
- 每个列表受限于 趋势样本大小(例如最近 10 个趋势)。
- 这些样本用于计算:
-
- 看涨平均 = 平均看涨趋势长度。
- 看跌平均 = 平均看跌趋势长度。
- 可能长度投影
在 每个新趋势开始时,如果有足够的样本:
这些投影 作为历史保留在图表上,以便你可以直观比较预测与实际的趋势持续时间。 -
- 计算该趋势类型(看涨或看跌)的平均长度。
- 从趋势起始柱绘制一条大约该长度的水平线。
- 在线的中心放置一个标签:
-
PL: X→ 可能长度 = X 根柱子。
- 实时标签
每根柱子,指标在 HMA 附近绘制一个实时标签:
显示 当前趋势方向 和确切的 已持续多少根柱子。 -
- 示例文本:
-
趋势 ↑
实际长度: 7
- 颜色:
-
- 看涨趋势为绿色 (↑)
- 看跌趋势为橙色/红色 (↓)
- 显示面板(左下角)
当启用 显示面板 时,图表角落会出现一个静态文本面板,显示:
这作为该符号/时间框架上近期趋势行为的快速统计概览。 -
- 标题: 趋势周期
看涨平均: X 根柱子看跌平均: Y 根柱子看涨样本:最近看涨趋势长度列表看跌样本:最近看跌趋势长度列表
实际使用中的阅读方法
- 绿色 HMA + “趋势 ↑”
→ 当前处于看涨趋势。
→实际长度告诉你它已经持续了多少根柱子。
→ 最近的PL: X线给你一个视觉上的参考,显示类似看涨趋势通常持续多久。 - 红色 HMA + “趋势 ↓”
→ 当前处于看跌趋势。
→实际长度= 当前下跌趋势的年龄。
→ 在面板中比较实际长度与看跌平均,判断该走势是年轻还是成熟。 - 当实际长度接近或超过平均值(看涨平均 / 看跌平均)时:
→ 当前趋势在统计上相较于近期历史是“老”的。
→ 你可以选择: -
- 收紧止损,
- 锁定利润,
- 对该方向的新入场更加谨慎。
- 短趋势与长趋势
-
- 许多非常短的趋势 → 震荡/均值回归环境。
- 少数长趋势 → 更具方向性的市场,伴随延伸走势。
摘要
AI 摘要
Trend Cycle is a technical indicator designed to analyze trend duration in financial markets. It detects bullish and bearish trends by evaluating the slope of a Hull Moving Average (HMA) applied to closing prices, providing a smoother yet responsive measure of trend direction. The indicator counts the number of bars the current trend has been active (Real Length) and records the lengths of recent up-trends and down-trends separately. Using these samples, it calculates average durations for bullish and bearish trends.
Visual elements include a green HMA line during bullish trends and a red HMA line during bearish trends. Horizontal projection lines mark the probable length of each trend at its start, labeled with "PL: X" to indicate expected duration in bars. A live label near the current price displays the active trend direction and its age in bars. An optional display panel offers a summary of average trend durations and recent trend length samples.
Trend Cycle helps users assess how long the current trend has lasted relative to historical trends, aiding decisions such as adjusting stops or managing entries. It supports analysis across various markets including Forex, cryptocurrencies, indices, commodities, and stocks.
指标配置
客户评价
0.0
评价:0
客户评价
该产品尚无评价。已经试过了?抢先告诉其他人!
讨论
常见问答
BTCUSD
Forex
Signal
Breakout
Indices
EURUSD
Commodities
GBPUSD
NZDUSD
Martingale
Bollinger
Prop
ZigZag
Scalping
Supertrend
Crypto
Grid
Stocks
AI
XAUUSD
NAS100
USDJPY
cTrader Store 提供的所有产品,包括交易机器人、指标和插件,均由第三方开发者提供,仅供信息参考和技术访问之用。cTrader Store 并非经纪商,不提供投资建议、个人推荐或任何未来业绩保证。


价格
42.11M
交易量
6.13M
盈利点数
230
销售
8.52K
免费安装