
Compare Symbol
Indicador
192 descargas
Versión 1.0, May 2025
Windows, Mac
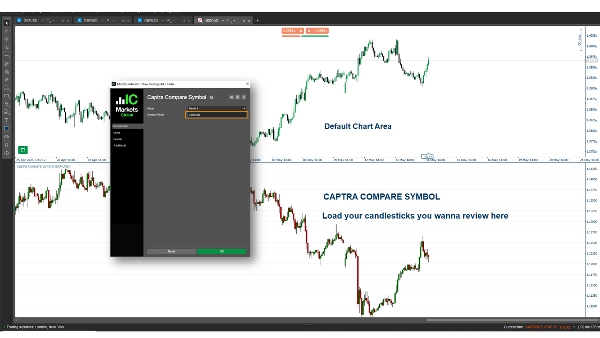
Captra Compare Symbol es un indicador de cTrader que muestra el precio de cierre y dibuja velas (mecha, cuerpo) para un símbolo seleccionado, como EURUSD, en el gráfico. Soporta varios marcos temporales (por ejemplo, 5M, 15M, 1H, Diario) con visuales personalizables, utilizando precios de apertura/cierre/alto/bajo para una representación precisa.
Perfil del indicador
0.0
Valoraciones: 0
Valoraciones de clientes
Este producto todavía no se ha valorado. ¿Ya lo ha probado? Sea el primero en informar a otros.
EURUSD
Los productos disponibles a través de cTrader Store, incluidos bots, indicadores y plugins para operar, son proporcionados por desarrolladores de terceros y están disponibles únicamente con fines informativos y de acceso técnico. cTrader Store no es un bróker, por lo que no proporciona asesoramiento de inversión, recomendaciones personales ni ninguna garantía de rentabilidad futura.
Más de este autor


86.17M
Volumen operado
1.91M
Pips ganados
3.57K
Instalaciones gratis