
Deskripsi
MFI-MTF: Indeks Aliran Uang Multi-Timeframe
Ikhtisar
MFI- MTF adalah indikator momentum multi-timeframe yang membawa perspektif timeframe yang lebih tinggi ke grafik Anda saat ini. Dengan menghitung Indeks Aliran Uang (MFI) pada timeframe yang lebih besar dan menampilkannya pada grafik kerja Anda, indikator ini membantu Anda mengidentifikasi kondisi jenuh beli dan jenuh jual di berbagai perspektif pasar tanpa harus beralih secara manual antar timeframe.
Fungsinya
Analisis Indeks Aliran Uang: Indikator mengukur tekanan beli dan jual dengan menganalisis pergerakan harga dan volume perdagangan. Indikator ini berosilasi antara 0 dan 100, mengidentifikasi saat suatu aset mengalami tekanan beli berlebihan (jenuh beli) atau tekanan jual berlebihan (jenuh jual).
Konteks Timeframe Lebih Tinggi: Alih-alih menghitung MFI pada timeframe grafik Anda saat ini, MFIMTF mengambil data dari timeframe yang lebih besar yang Anda tentukan (harian, mingguan, 4 jam, dll.). Ini memberikan wawasan momentum tingkat institusional tanpa gangguan dari timeframe yang lebih rendah. Ketika MFI harian menunjukkan kondisi jenuh beli, misalnya, Anda tahu tren yang lebih besar sedang mencapai kelelahan—konteks berharga untuk keputusan masuk dan keluar.
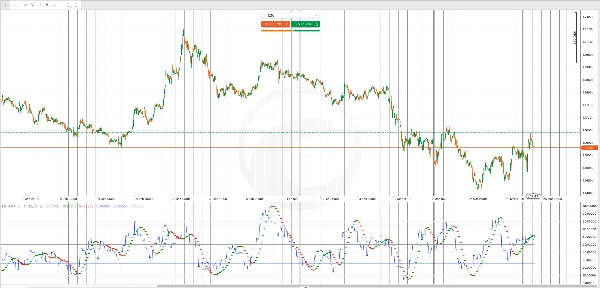
Filter Hull Moving Average: Hull Moving Average (HMA) yang diterapkan pada MFI menghaluskan fluktuasi tajam dan menyoroti pergeseran momentum arah. Titik hijau menandai tren naik momentum, sementara titik merah menandai tren turun, memberi Anda konfirmasi visual cepat tentang perubahan arah momentum.
Output Utama
Garis MFI (Biru): Nilai utama Indeks Aliran Uang dari timeframe lebih tinggi yang Anda pilih, ditampilkan pada setiap bar grafik Anda saat ini.
Sinyal HMA (Titik Hijau/Merah): Titik hijau muncul saat momentum menguat ke atas; titik merah muncul saat momentum melemah atau berbalik ke bawah. Ini berfungsi sebagai sinyal peringatan dini untuk kemungkinan pembalikan.
Level Referensi:
- Level Jenuh Beli (default 70): Ketika MFI melebihi ini, tekanan beli berlebihan dan pembalikan menjadi mungkin
- Level Jenuh Jual (default 30): Ketika MFI turun di bawah ini, tekanan jual habis dan pantulan menjadi mungkin
- Garis Tengah (50): Titik keseimbangan netral antara momentum bullish dan bearish
Kustomisasi
Pemilihan Timeframe: Pilih timeframe apa pun yang lebih tinggi dari grafik Anda saat ini (harian pada grafik 1 jam, misalnya). Timeframe yang lebih besar memberikan konteks tren yang lebih luas tetapi sinyal lebih jarang; kenaikan yang lebih kecil menawarkan lebih banyak peluang trading tetapi dengan perspektif strategis yang lebih sedikit.
Periode MFI: Sesuaikan periode lookback untuk Indeks Aliran Uang (default 14). Periode yang lebih pendek membuat indikator lebih responsif terhadap perubahan volume terbaru; periode yang lebih panjang menghaluskan volatilitas dan mengurangi sinyal palsu.
Periode HMA: Kontrol penghalusan filter momentum. Periode yang lebih pendek membuat perubahan tren lebih jelas tetapi lebih berisik; periode yang lebih panjang mengonfirmasi tren dengan lebih andal tetapi dengan generasi sinyal yang lebih lambat.
Ambang Jenuh Beli/Jual: Sesuaikan level ini agar sesuai dengan gaya trading Anda. Trader konservatif mungkin menggunakan 75/25; trader agresif mungkin menggunakan 80/20 untuk menunggu kondisi yang lebih ekstrem.
Penggunaan Praktis
Gunakan MFI MTF untuk menambah konfluensi pada entri dan keluar Anda. Sinyal jual pada timeframe kerja Anda menjadi lebih dapat diandalkan jika MFI harian sudah jenuh beli, menunjukkan bahwa penjual institusional kemungkinan aktif. Demikian pula, sinyal beli menjadi lebih kuat ketika MFI timeframe lebih tinggi jenuh jual, menunjukkan bahwa tekanan jual telah habis pada tingkat makro.
Perubahan warna HMA memberi Anda peringatan waktu nyata terhadap pergeseran momentum, membantu Anda keluar dari perdagangan yang merugi lebih awal atau mengurangi ukuran posisi sebelum pembalikan menjadi parah.
Ringkasan
The indicator includes a Hull Moving Average (HMA) filter applied to the MFI to smooth out noise and highlight momentum shifts. Green dots indicate strengthening upward momentum, while red dots signal weakening or downward momentum. Reference levels include default overbought (70), oversold (30), and a neutral midpoint (50), all customizable to fit different trading styles.
Key outputs are the MFI line from the chosen higher timeframe and HMA signals for momentum direction changes. Adjustable parameters include the MFI lookback period, HMA smoothing period, and overbought/oversold thresholds. MFI-MTF aids in confirming entry and exit points by providing institutional-level momentum insights and real-time alerts to momentum shifts on your working chart.
Ulasan pelanggan
5 | 100 % | |
4 | 0 % | |
3 | 0 % | |
2 | 0 % | |
1 | 0 % |


![Logo "High-Low Divergence [Iridio Capital]"](https://cdn.ctrader.com/image/webp/443c4661-7abb-40f1-842f-4b6ec560649b_40914)


