Deskripsi
Proyeksi Harga Dinamis 📈🔮
https://chartshots.spotware.com/c/69d5304ea1cc1
Apa Itu?
https://chartshots.spotware.com/c/69d52fb4b01cd
Proyeksi Harga Dinamis adalah indikator overlay yang memproyeksikan jalur harga masa depan yang secara statistik mungkin menggunakan simulasi Monte Carlo dan mengevaluasi bias arah melalui klasifikasi probabilitas Bayesian. Ini menjawab satu pertanyaan: mengacu pada bagaimana aset ini bergerak, kemana secara statistik kemungkinan besar akan bergerak selanjutnya? 📊
https://chartshots.spotware.com/c/69d53010d38ce
Cara Kerjanya ⚙️
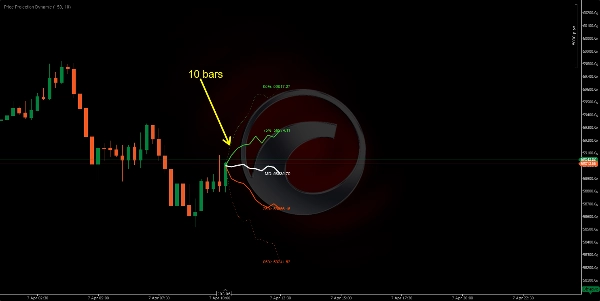
Mesin 1 — Proyeksi Monte Carlo 🎲
Indikator menganalisis riwayat harga terbaru dan mengekstrak imbal hasil logaritmik. Ini menghitung rata-rata imbal hasil dan deviasi standarnya — menangkap baik drift (kecenderungan) dan volatilitas (pergerakan tidak menentu) 🌪️.
Ini menjalankan 200 jalur harga simulasi (hingga 500) ke masa depan. Setiap simulasi adalah "jalan acak" berdasarkan aksi nyata terbaru. Dari sini, indikator mengekstrak 5 pita persentil:
Pita
Makna
95%
Ekstrem optimis — hanya 5% simulasi yang lebih tinggi 🚀
75%
Rentang probable atas — harga berakhir di atas ini dalam 25% simulasi 📈
50% (MD)
Proyeksi median — pusat statistik dari semua hasil 🎯
25%
Rentang probable bawah — harga berakhir di bawah ini dalam 25% simulasi 📉
05%
Ekstrem pesimis — hanya 5% simulasi yang lebih rendah 📉🛑
Tips Pro: Semakin lebar kipas terbuka, semakin tinggi volatilitas saat ini 📢. Kipas yang rapat berarti aset bergerak dengan prediktabilitas 🧵.
Mesin 2 — Klasifikator Bayesian 🧠
Terlepas dari proyeksi, mesin ini mengklasifikasikan pasar sebagai bullish atau bearish dengan:
- Melihat kembali selama jendela waktu (default 500 bar) 🔍.
- Mengukur volume relatif dan momentum untuk bar bullish vs. bearish.
- Menghitung profil mana yang bar saat ini cocok menggunakan probabilitas Gaussian ⚖️.
Hasilnya adalah persentase probabilitas kemenangan:
Probabilitas
Interpretasi
> 70%
Kepercayaan bullish tinggi ✅🟢
50–70%
Sedang / tidak jelas ⚖️🟡
< 30%
Kepercayaan bearish tinggi ✅🔴
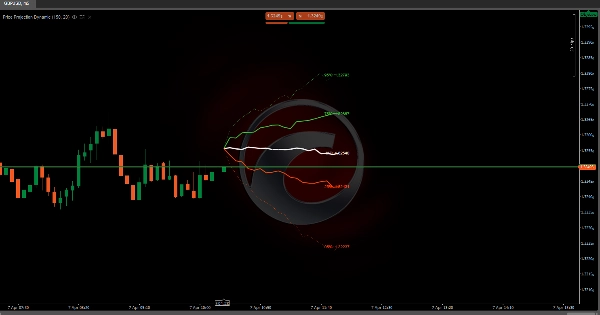
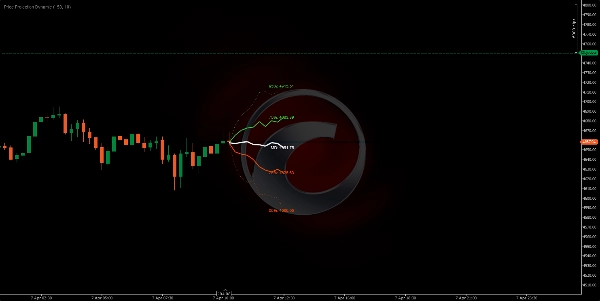
Elemen Visual 🎨
- Garis hijau (75%, 95%): Pita proyeksi atas — rentang bullish 🍏
- Garis putih (MD): Harga proyeksi median — jalur yang paling mungkin 🏁
- Garis oranye (25%, 05%): Pita proyeksi bawah — rentang bearish 🍊
- Garis luar putus-putus: Ekstrem 95% dan 05% (batas probabilitas rendah) ⚠️
- Garis dalam solid: 75%, 50%, 25% (zona probabilitas tinggi) ✅
- Label harga: Harga proyeksi tepat untuk setiap persentil 🏷️
- Panel info (kanan atas): Probabilitas kemenangan Bayesian, target median, volume relatif, arah sinyal 🖥️
Cara Menggunakan 📖
- Baca bentuk kipas 📢 — Jika melebar dengan cepat, volatilitas tinggi dan proyeksi kurang pasti.
- Gunakan garis median (MD) 🎯 sebagai target harga masa depan yang paling mungkin secara statistik.
- Gunakan pita 75%/25% 📏 sebagai target atas/bawah yang realistis untuk perdagangan.
- Gunakan pita 95%/05% 🛑 sebagai batas ekstrem — berguna untuk penempatan stop loss.
- Periksa panel Bayesian 🧠 — Probabilitas di atas 70% atau di bawah 30% menambah keyakinan arah.
- Gabungkan kedua mesin 🤝 — Jika garis median miring ke atas DAN probabilitas Bayesian > 70%, setup secara statistik kuat.
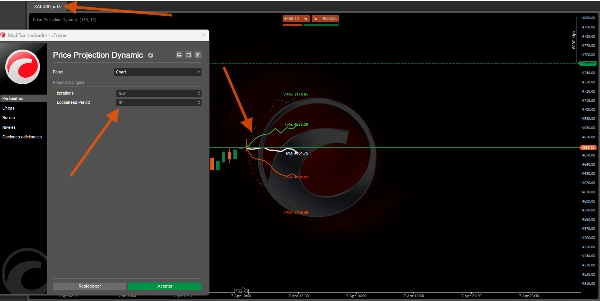
Parameter Kunci ⚙️
Parameter
Apa yang Dikendalikan
Nilai Lebih Tinggi
Nilai Lebih Rendah
Iterasi
Jumlah jalur simulasi
Pita lebih halus 🌊
Perhitungan lebih cepat ⚡
Lookahead
Jarak proyeksi masa depan
Horizon lebih panjang 🔭
Lebih pendek, lebih dapat diandalkan 🔍
Kedalaman Sampel
Bar terbaru untuk dianalisis
Perilaku jangka panjang 🐢
Hanya perilaku terbaru 🐇
Jendela Klasifikator
Riwayat Bayesian
Probabilitas lebih stabil ⚖️
Lebih reaktif ⚡
Profil Indikator 📋
- Kategori indikator: Statistik 📊
- Jenis output: Visualisasi & Sinyal 🖼️
- Persyaratan data: Hanya bar 📶
Penafian ⚠️
Indikator ini memproyeksikan probabilitas statistik, bukan prediksi 🔮. Simulasi Monte Carlo mengasumsikan masa depan akan mirip dengan masa lalu terbaru — ini tidak berlaku selama peristiwa angsa hitam 🦢 atau celah yang dipicu berita. Gunakan sebagai kerangka probabilistik bersama dengan manajemen risiko Anda sendiri 🛡️.
Ringkasan
Separately, the Bayesian classifier evaluates market sentiment by analyzing relative volume and momentum over a configurable window, providing a win probability percentage that indicates bullish or bearish confidence. Visual elements include color-coded projection bands (green for bullish, orange for bearish), a median price line, price labels for each percentile, and an info panel displaying Bayesian probability and other metrics.
Key adjustable parameters include the number of simulation iterations, projection horizon, sample depth of historical bars, and classifier window size. The indicator requires bar data with volume and outputs visual projections and directional signals. It is designed to offer a probabilistic framework for anticipating price movement based on recent market behavior, suitable for various symbols including BTCUSD, EURUSD, GBPUSD, XAUUSD, NAS100, and others.
Ulasan pelanggan
5 | 0 % | |
4 | 100 % | |
3 | 0 % | |
2 | 0 % | |
1 | 0 % |